Fig. 9
Download original image
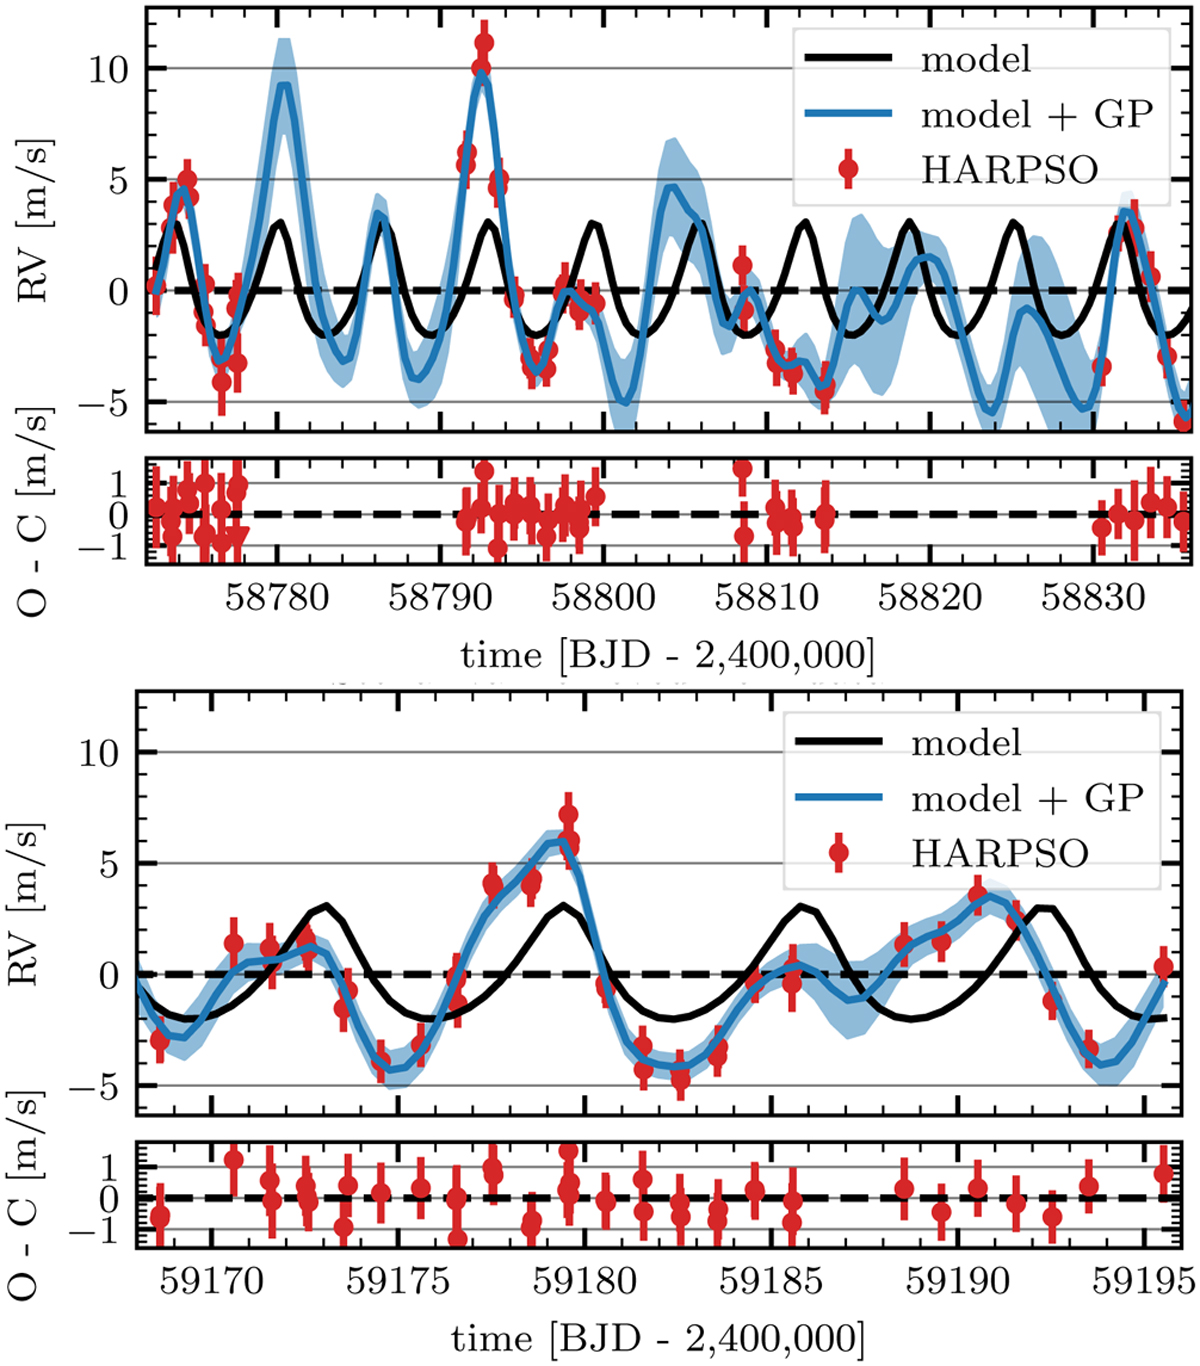
Time series of the RVs of the first observing season (top panel) and second observing season (bottom panel) displayed in red together with the best-fit Keplerian model (in black) and GP-fitted model used to account for stellar activity (in blue). The RVs were corrected by the systemic velocity and the RV trend. We show the 1 σ uncertainties from the GP model in shaded blue. We also show the residuals of the best model below the RVs.
Current usage metrics show cumulative count of Article Views (full-text article views including HTML views, PDF and ePub downloads, according to the available data) and Abstracts Views on Vision4Press platform.
Data correspond to usage on the plateform after 2015. The current usage metrics is available 48-96 hours after online publication and is updated daily on week days.
Initial download of the metrics may take a while.