Fig. 4
Download original image
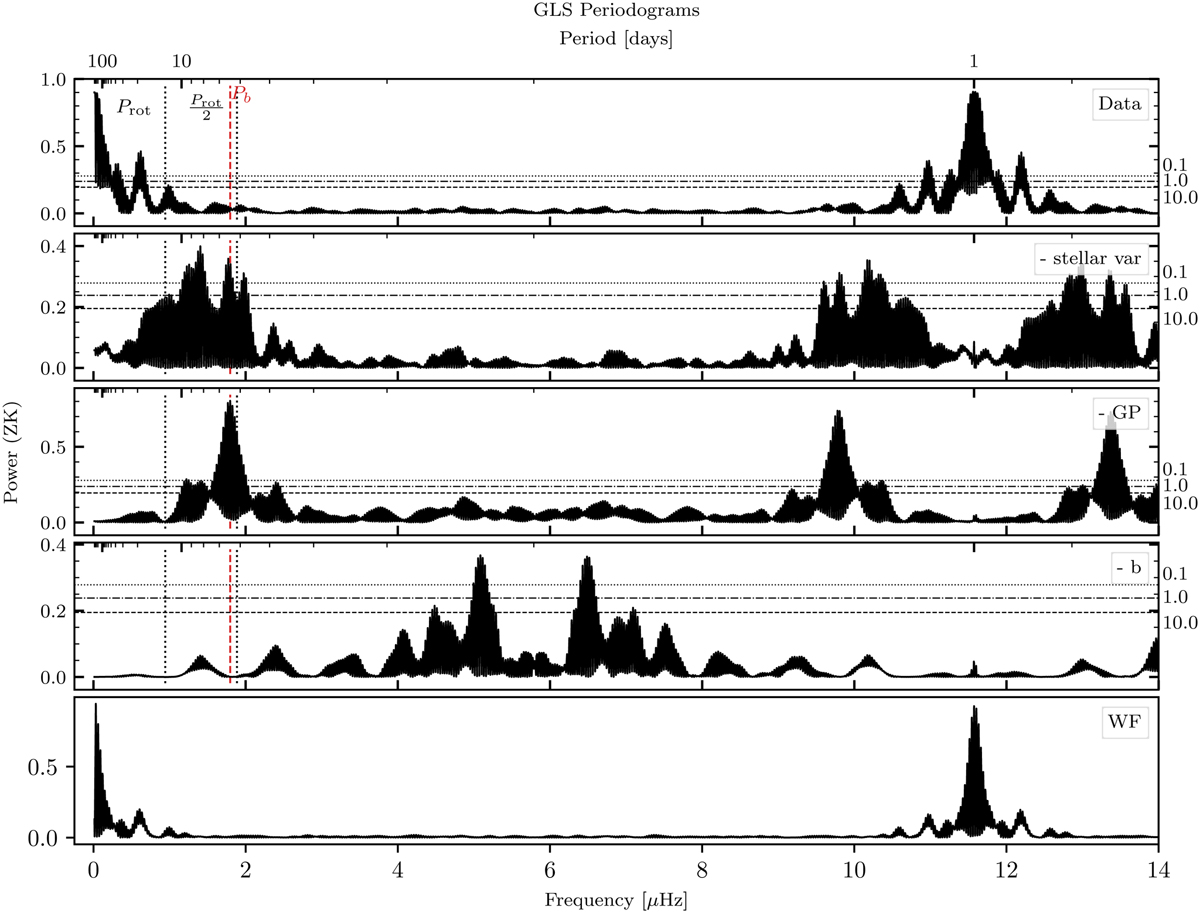
Interactive GLS of the final model. The top panel shows the GLS of the observed RVs. The subsequent panels show the previous row minus the model of the long-term trend (stellar variability), the model of the GP, and the model of the planet. The last panel shows the window function. The horizontal lines show the 10% (dashed line), 1% (dot-dashed line), and 0.1% (dotted line) FAP levels calculated following Zechmeister & Kürster (2009). The vertical dotted coloured line shows the position of the HD 207496 b, while the vertical dotted black lines show the position of the rotation period of the star and its first harmonic.
Current usage metrics show cumulative count of Article Views (full-text article views including HTML views, PDF and ePub downloads, according to the available data) and Abstracts Views on Vision4Press platform.
Data correspond to usage on the plateform after 2015. The current usage metrics is available 48-96 hours after online publication and is updated daily on week days.
Initial download of the metrics may take a while.