Fig. 14
Download original image
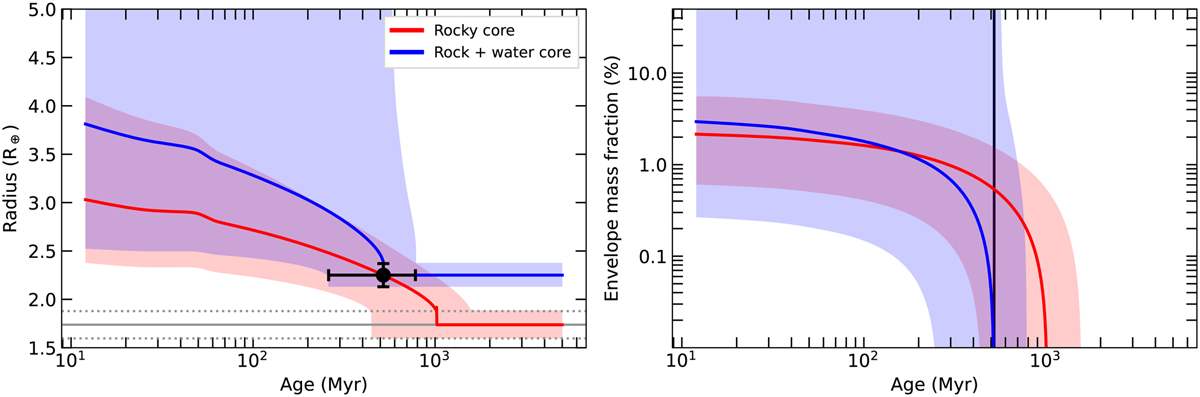
History of HD 207496b. Left panel: plot showing the radius evolution of HD 207496 b using the gaseous planet (red line) and ocean planet (blue line) scenarios. The uncertainties on the evaporation histories are shown as shaded regions, and are based on the errors for the age, mass, and radius, as described in Sect. 5.2. The location of HD 207496 b, based on its measured radius and age, is shown as a black circle. The rocky core radius for the gaseous planet scenario (from Sect. 5.1.1) is shown as a horizontal grey line, with its uncertainty shown as dashed lines. Right panel: plot showing the corresponding evolution of the envelope mass fraction of HD 207496 b, mirroring the left-hand side panel. The measured mean age of the planet is shown as a black line.
Current usage metrics show cumulative count of Article Views (full-text article views including HTML views, PDF and ePub downloads, according to the available data) and Abstracts Views on Vision4Press platform.
Data correspond to usage on the plateform after 2015. The current usage metrics is available 48-96 hours after online publication and is updated daily on week days.
Initial download of the metrics may take a while.