Fig. 10
Download original image
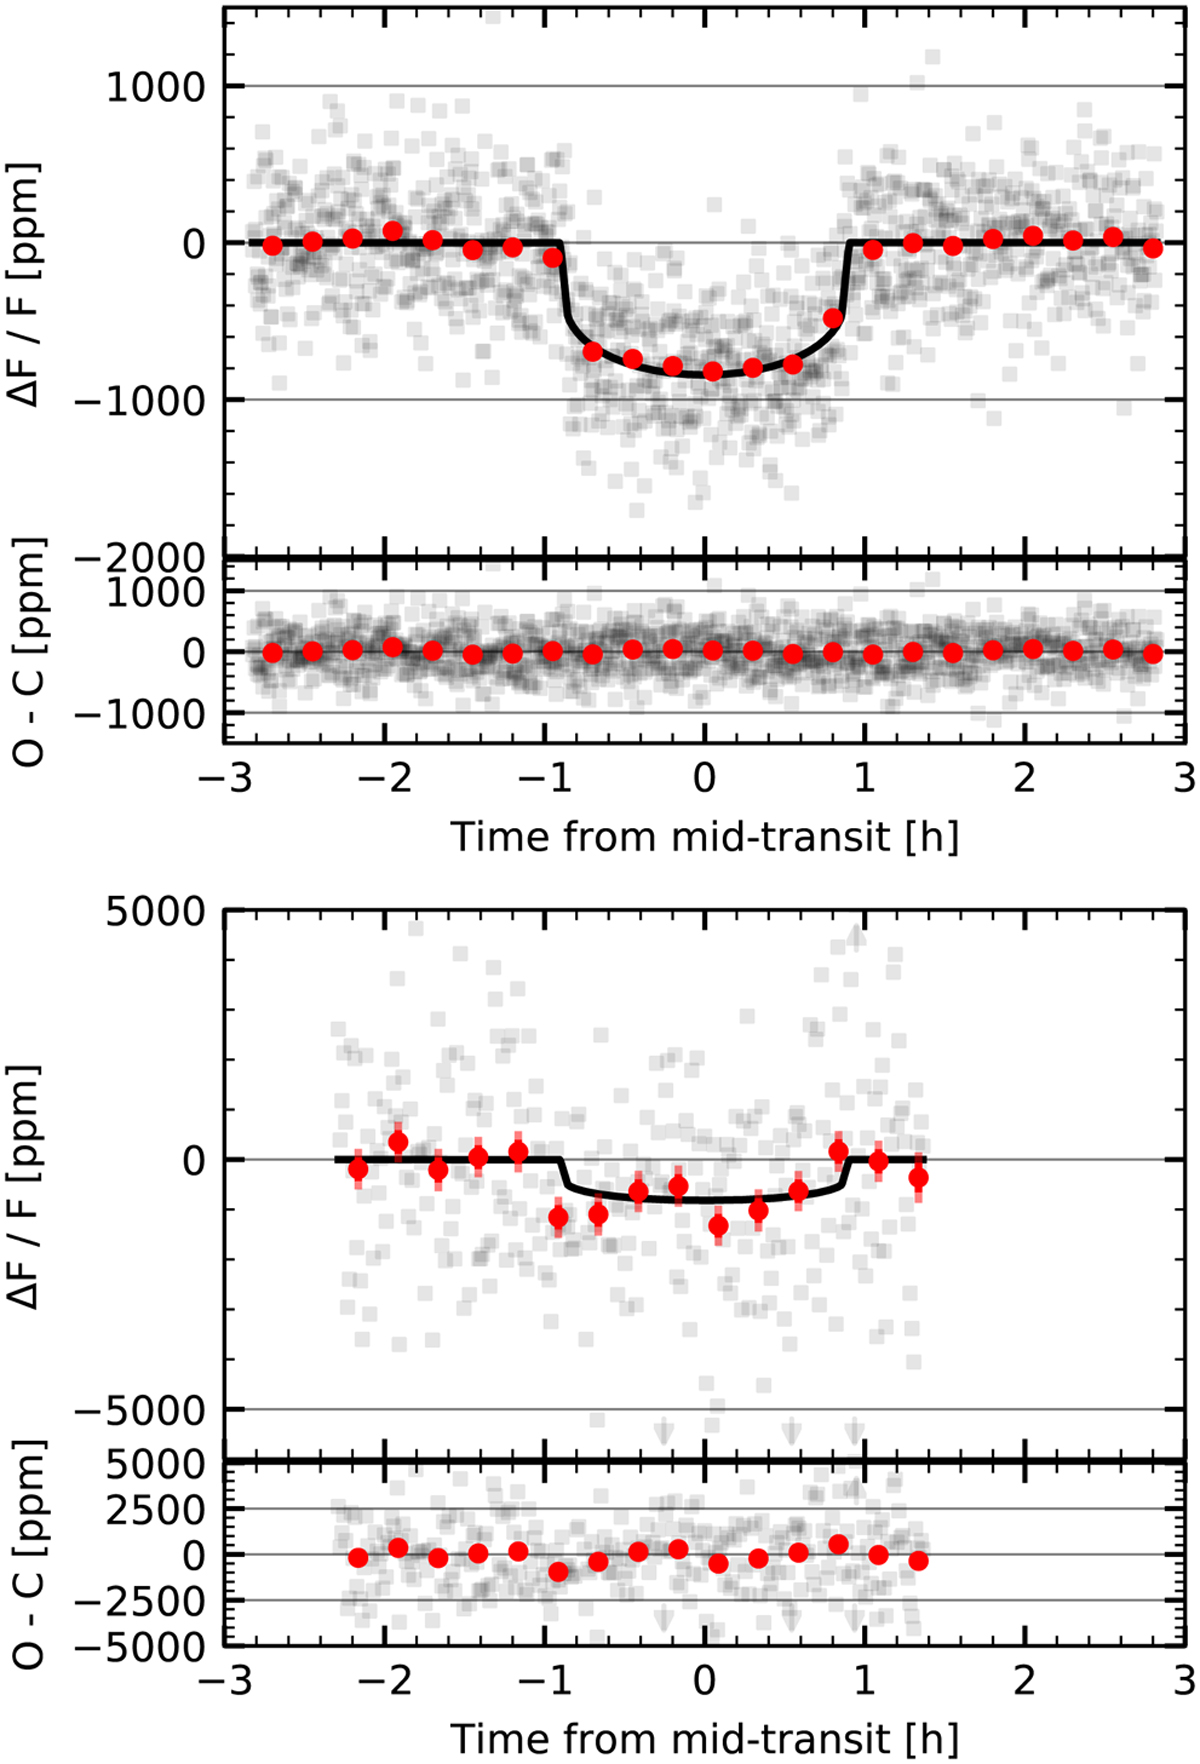
Phase-folded transit light curves. Top panel: phase-folded transit light curve (grey dots) obtained by the TESS satellite. We have overplotted the 15 min binned light curve and the corresponding uncertainties in red. We have also overplotted the best-fit model in black. The uncertainties of the unbinned data have not been displayed for clarity. Below the light curve, we show the residuals relative to the best model. Bottom panel: same as the other panel, but for the LCOGT transit.
Current usage metrics show cumulative count of Article Views (full-text article views including HTML views, PDF and ePub downloads, according to the available data) and Abstracts Views on Vision4Press platform.
Data correspond to usage on the plateform after 2015. The current usage metrics is available 48-96 hours after online publication and is updated daily on week days.
Initial download of the metrics may take a while.