Fig. 8.
Download original image
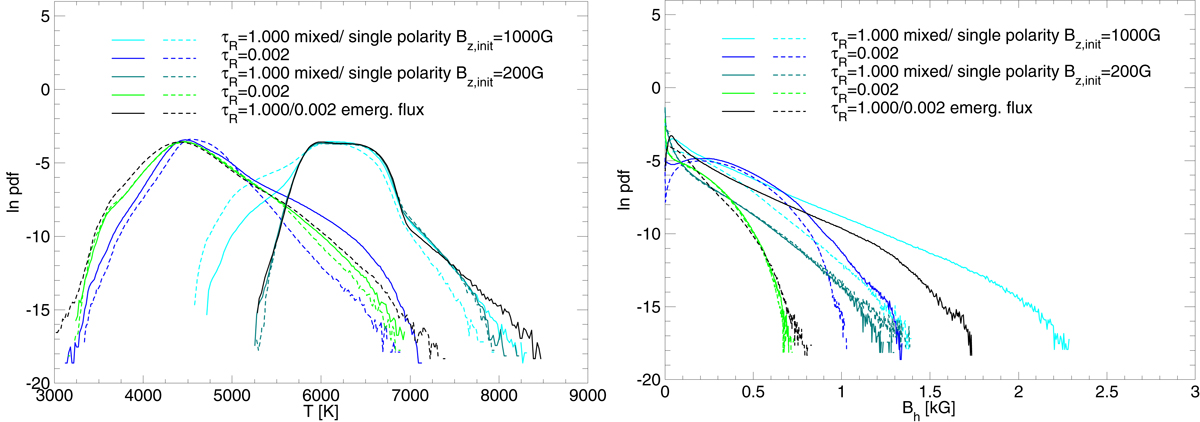
Probability distributions of the temperature (left panel) and the horizontal magnetic field Bh (right panel). Results for the mixed-polarity and single-polarity runs (Sect. 2.2.3) with ‖Bz,init‖ = 1000 G are shown in solid cyan and dashed cyan for τR = 1 and solid blue and dashed blue for τR = 2 × 10⁻³, respectively, whereas results for the run with ‖Bz,init‖ = 200 G are indicated in solid emerald green and dashed emerald green for τR = 1 and solid green and dashed green for τR = 2 × 10⁻³, respectively. The flux-emergence simulation results are shown in black for τR = 1 (solid) and τR = 2 × 10⁻³ (dashed).
Current usage metrics show cumulative count of Article Views (full-text article views including HTML views, PDF and ePub downloads, according to the available data) and Abstracts Views on Vision4Press platform.
Data correspond to usage on the plateform after 2015. The current usage metrics is available 48-96 hours after online publication and is updated daily on week days.
Initial download of the metrics may take a while.