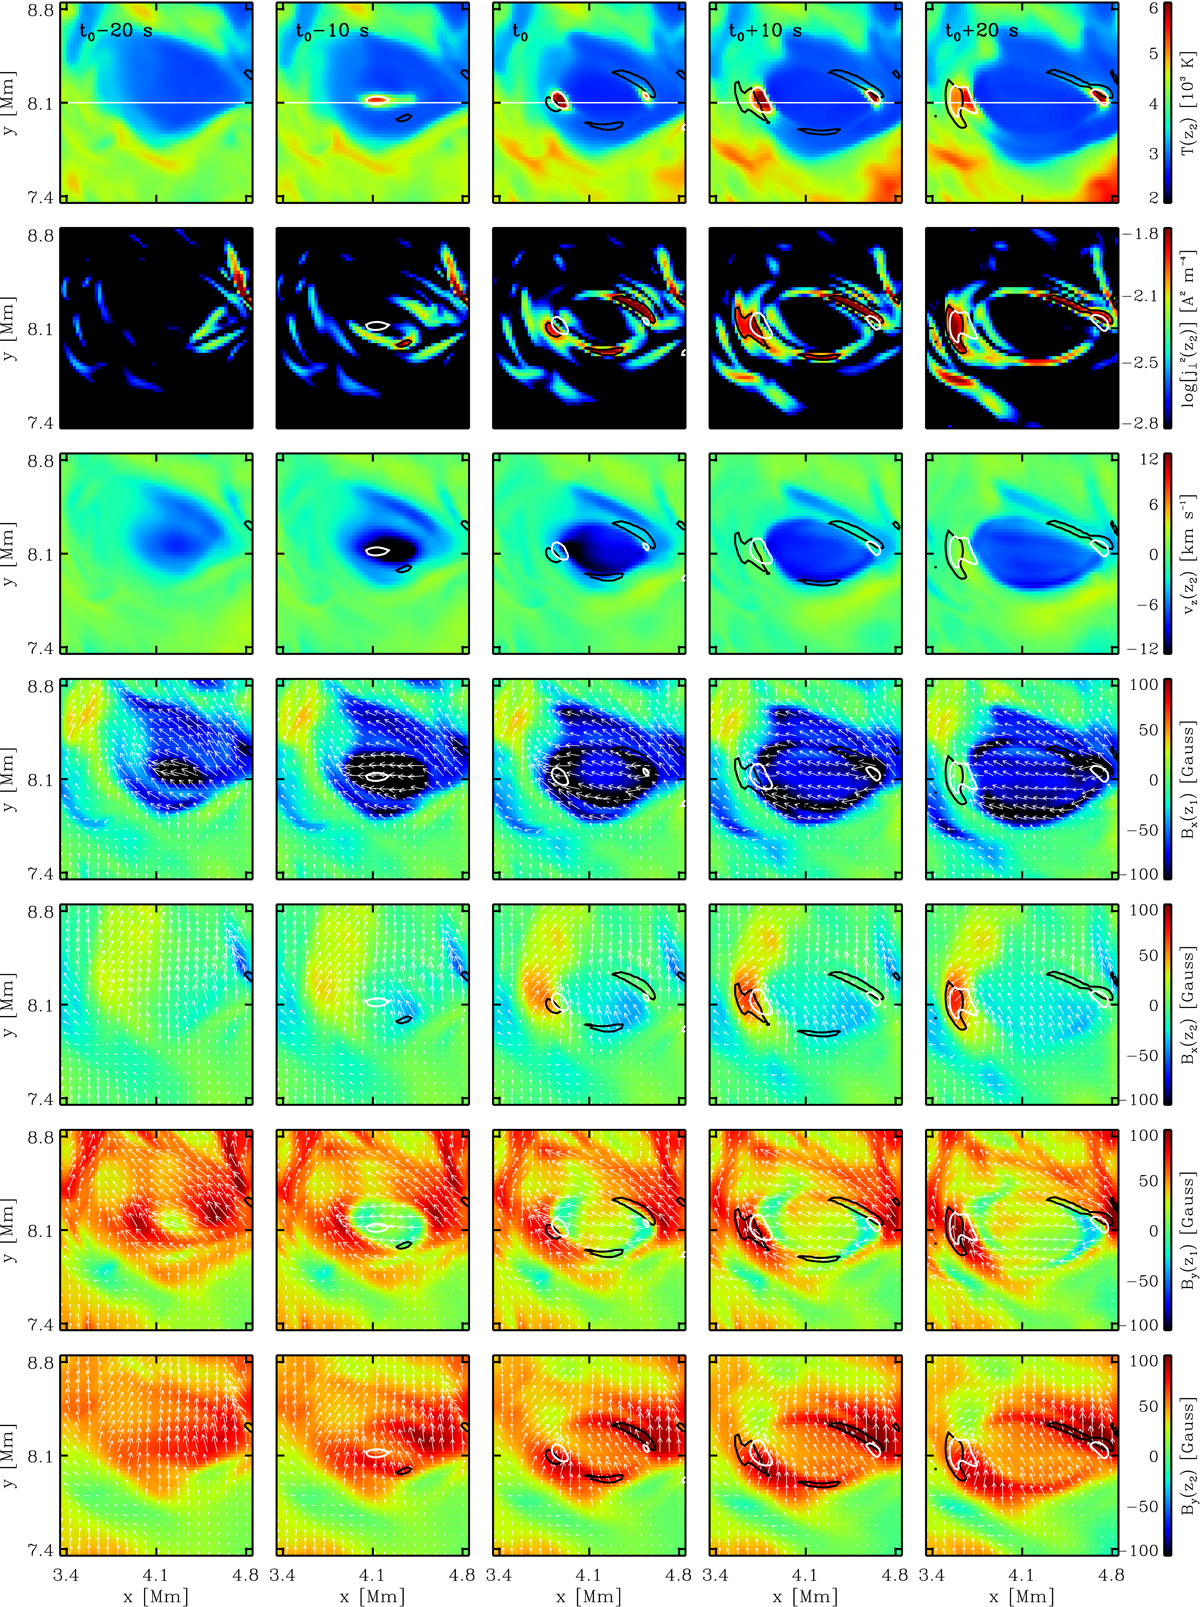
Fig. 11.
Download original image
Temporal evolution of the physical parameters during a reconnection event seen in the flux-emergence simulations. Values are given on the solar surface (x, y) at two different heights: z1 = −0.57 Mm and z2 = −0.60 Mm, with z2 being closer to the upper boundary of the simulation box. The location of the reconnection event is indicated by the squared box in Figs. 4 and 5. From top to bottom: T(x, y, z2), logarithm of the square of the horizontal component of the electric current ![]() , vertical component of the velocity vz(x, y, z2) (vz < 0 are upflows), Bx(x, y, z1), Bx(x, y, z2), By(x, y, z1), and By(x, y, z2). Arrow fields show the direction of the magnetic field on the (x, y) plane. The length of the arrows is proportional to
, vertical component of the velocity vz(x, y, z2) (vz < 0 are upflows), Bx(x, y, z1), Bx(x, y, z2), By(x, y, z1), and By(x, y, z2). Arrow fields show the direction of the magnetic field on the (x, y) plane. The length of the arrows is proportional to ![]() . White contours correspond to those regions where T(z2) > 4750 K, while black contours enclose regions where
. White contours correspond to those regions where T(z2) > 4750 K, while black contours enclose regions where ![]() where j2 units are A2 m−4. The white horizontal line on the uppermost panel at y = y1 = 8.1 Mm shows the slice that is used in Fig. 12.
where j2 units are A2 m−4. The white horizontal line on the uppermost panel at y = y1 = 8.1 Mm shows the slice that is used in Fig. 12.
Current usage metrics show cumulative count of Article Views (full-text article views including HTML views, PDF and ePub downloads, according to the available data) and Abstracts Views on Vision4Press platform.
Data correspond to usage on the plateform after 2015. The current usage metrics is available 48-96 hours after online publication and is updated daily on week days.
Initial download of the metrics may take a while.