Fig. 10.
Download original image
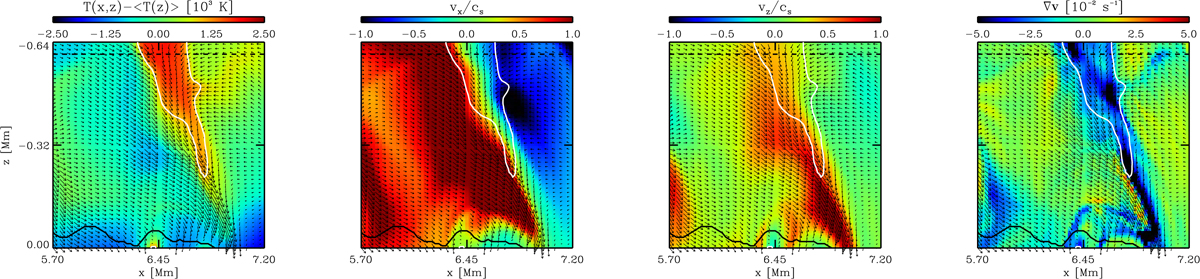
Overview of some physical parameters on the (x, z)-plane along the horizontal cut depicted by the horizontal line at y ≈ 5.3 Mm in the first row of Fig. 9. From left to right: temperature fluctuation with respect to the box-averaged T(z), ratio between vx and the local sound speed cs, ratio between vz and the local sound speed cs, and divergence of the velocity ∇ · v. White contours enclose regions where the temperature fluctuation is greater than 1000 K. The black solid line indicates the location where τR = 1. The horizontal black dashed line is located at z = z2 = −0.60 Mm and therefore corresponds to the height of the plane depicted in Fig. 9. Arrows indicate the velocity field in the (x, z)-plane.
Current usage metrics show cumulative count of Article Views (full-text article views including HTML views, PDF and ePub downloads, according to the available data) and Abstracts Views on Vision4Press platform.
Data correspond to usage on the plateform after 2015. The current usage metrics is available 48-96 hours after online publication and is updated daily on week days.
Initial download of the metrics may take a while.