Open Access
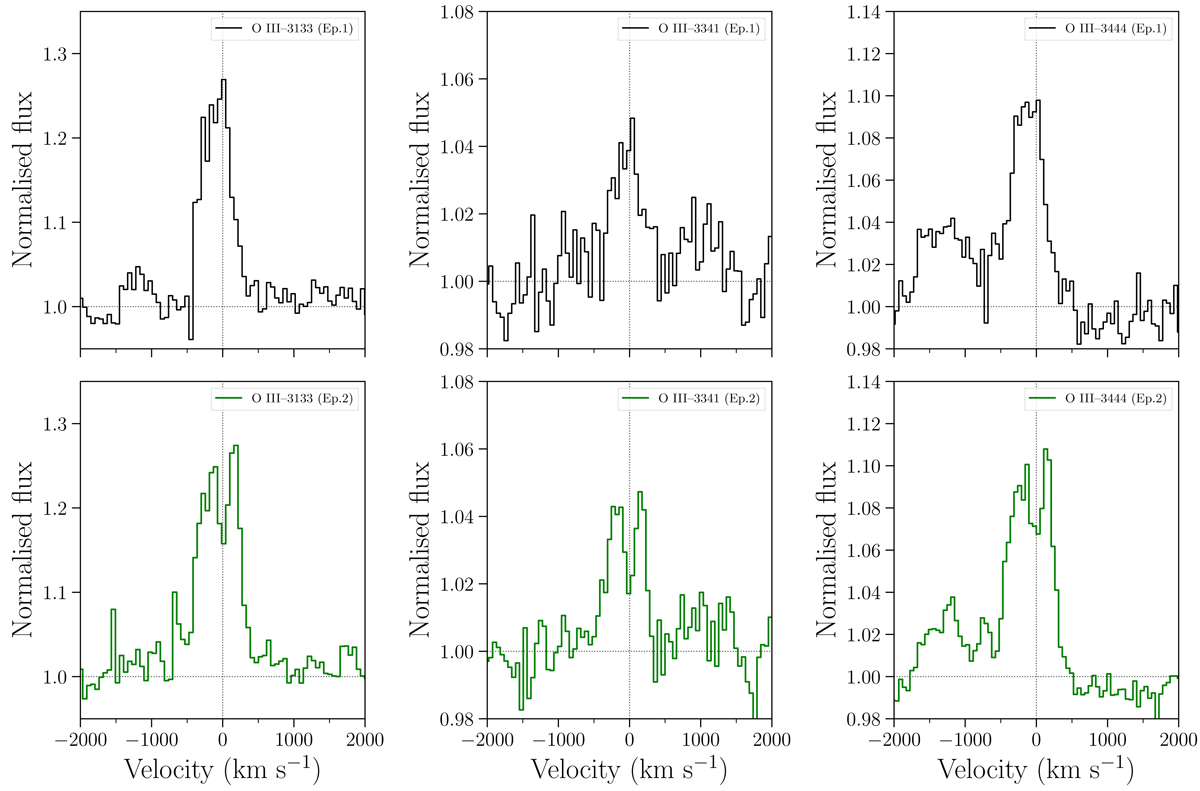
Fig. 5.
Download original image
Details of the three O III emission lines at 3133 Å, 3341 Å, and 3444 Å in the two epochs. The top row corresponds to epoch 1 (black) and the bottom row to epoch 2 (green). We note that O III lines are mostly single-peaked during epoch 1, whilst they are double-peaked in epoch 2.
Current usage metrics show cumulative count of Article Views (full-text article views including HTML views, PDF and ePub downloads, according to the available data) and Abstracts Views on Vision4Press platform.
Data correspond to usage on the plateform after 2015. The current usage metrics is available 48-96 hours after online publication and is updated daily on week days.
Initial download of the metrics may take a while.