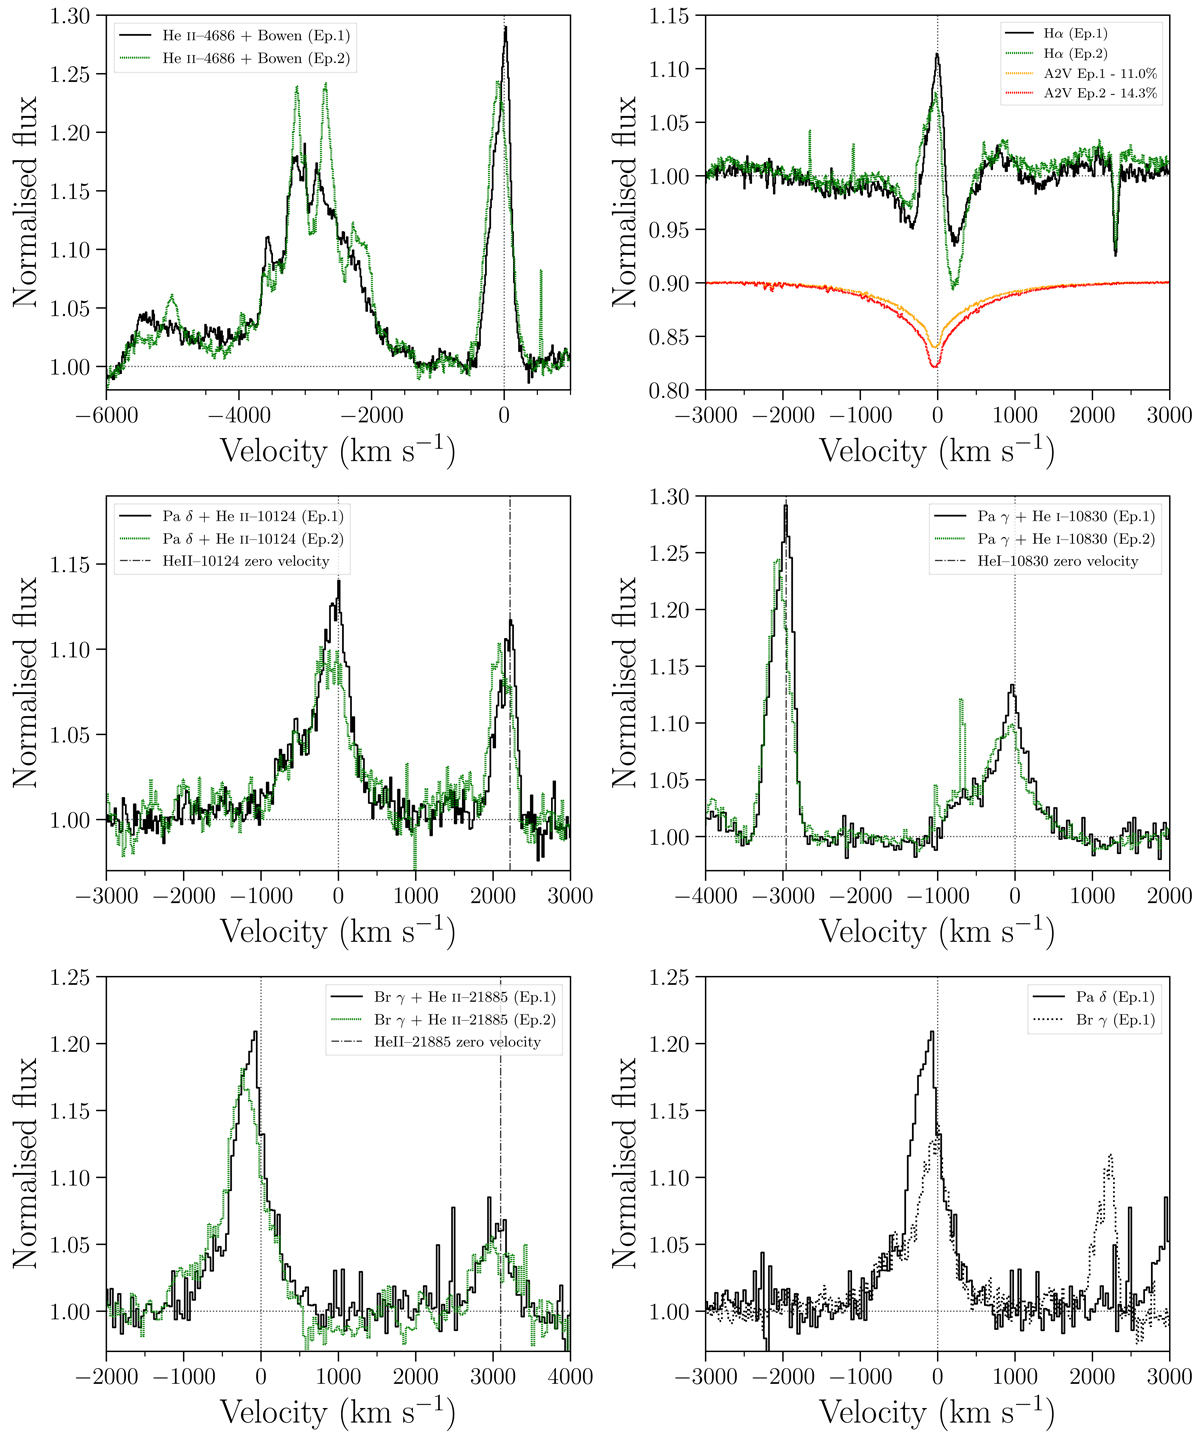
Fig. 4.
Download original image
Details of some emission lines in the spectra of both epochs. Zero velocities of He II–10124, He I–10830, and He II–21885 are marked with dash-dotted lines. We note that all H and He lines display clear red skewed profiles during epoch 1. Top left: He II–4686 + Bowen blend. The Bowen blend exhibits narrow emission components during epoch 2, which are not present in epoch 1. Top right: Hα profile. The emission is embedded in a broad absorption feature. The normalised spectra of an A2V star, with a scale-corrected contribution, are shown vertically displaced at 0.9 for comparison. Middle left: Paδ emission line and He II–10124 at ∼2200 km s−1. We note that Paδ shows a strong emission blue wing compared with the He II line. Middle right: Paγ and He I–10830 lines. We note that Paγ exhibits a blue emission wing. Bottom left: Brγ and He II–21885 lines. Bottom right: Paδ (solid) and Brγ (dotted) emission lines in epoch 1.
Current usage metrics show cumulative count of Article Views (full-text article views including HTML views, PDF and ePub downloads, according to the available data) and Abstracts Views on Vision4Press platform.
Data correspond to usage on the plateform after 2015. The current usage metrics is available 48-96 hours after online publication and is updated daily on week days.
Initial download of the metrics may take a while.