Open Access
Fig. 2.
Download original image
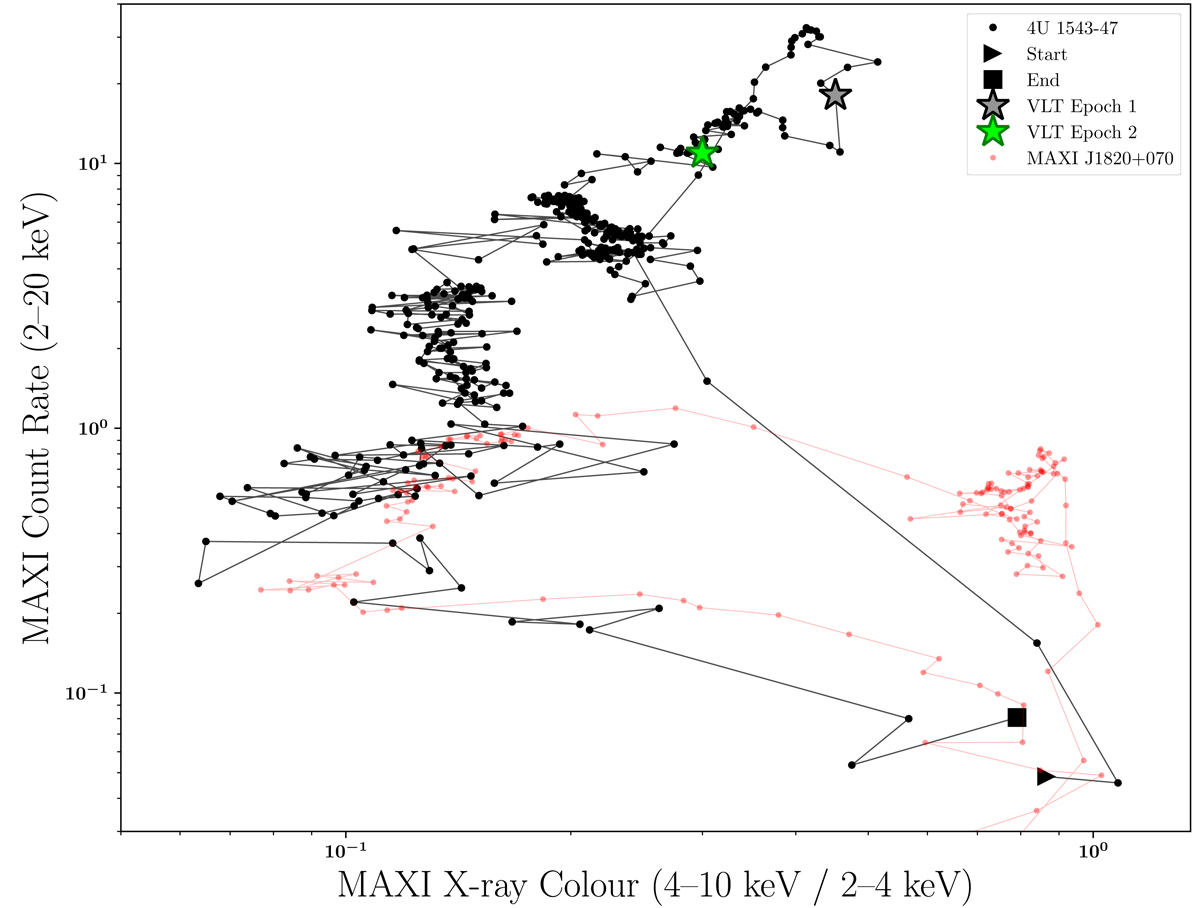
Hardness-intensity diagram of 4U 1543–47 during its 2021 outburst (from MAXI data). The VLT/X-shooter spectroscopic epochs 1 and 2 are marked with grey and green stars, respectively. The evolution of the 2018–2019 outburst of MAXI J1820+070 is over-plotted in red for the sake of comparison (see text).
Current usage metrics show cumulative count of Article Views (full-text article views including HTML views, PDF and ePub downloads, according to the available data) and Abstracts Views on Vision4Press platform.
Data correspond to usage on the plateform after 2015. The current usage metrics is available 48-96 hours after online publication and is updated daily on week days.
Initial download of the metrics may take a while.