Fig. 5.
Download original image
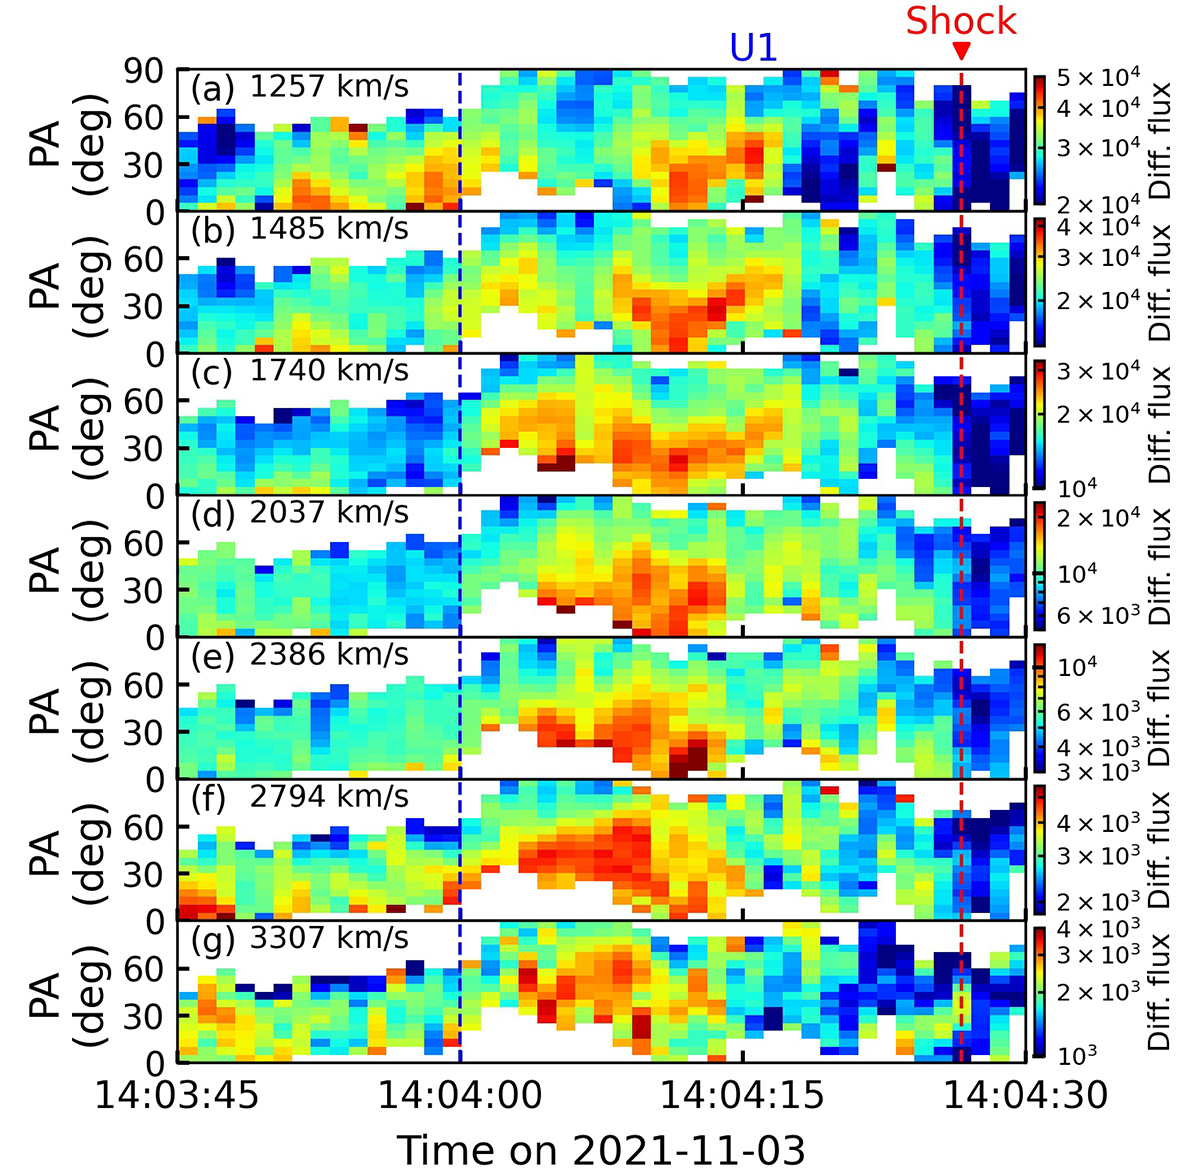
PAD spectrograms of ∼1200 − 3600 km s−1 protons in the 45-s vicinity of the 2021 November 3 shock. The color bar of each panel indicates the flux intensity for each velocity bin. The vertical dashed red line marks the shock front. The ∼26-s upstream interval bounded by the blue dashed blue line and the shock front is labeled U1.
Current usage metrics show cumulative count of Article Views (full-text article views including HTML views, PDF and ePub downloads, according to the available data) and Abstracts Views on Vision4Press platform.
Data correspond to usage on the plateform after 2015. The current usage metrics is available 48-96 hours after online publication and is updated daily on week days.
Initial download of the metrics may take a while.