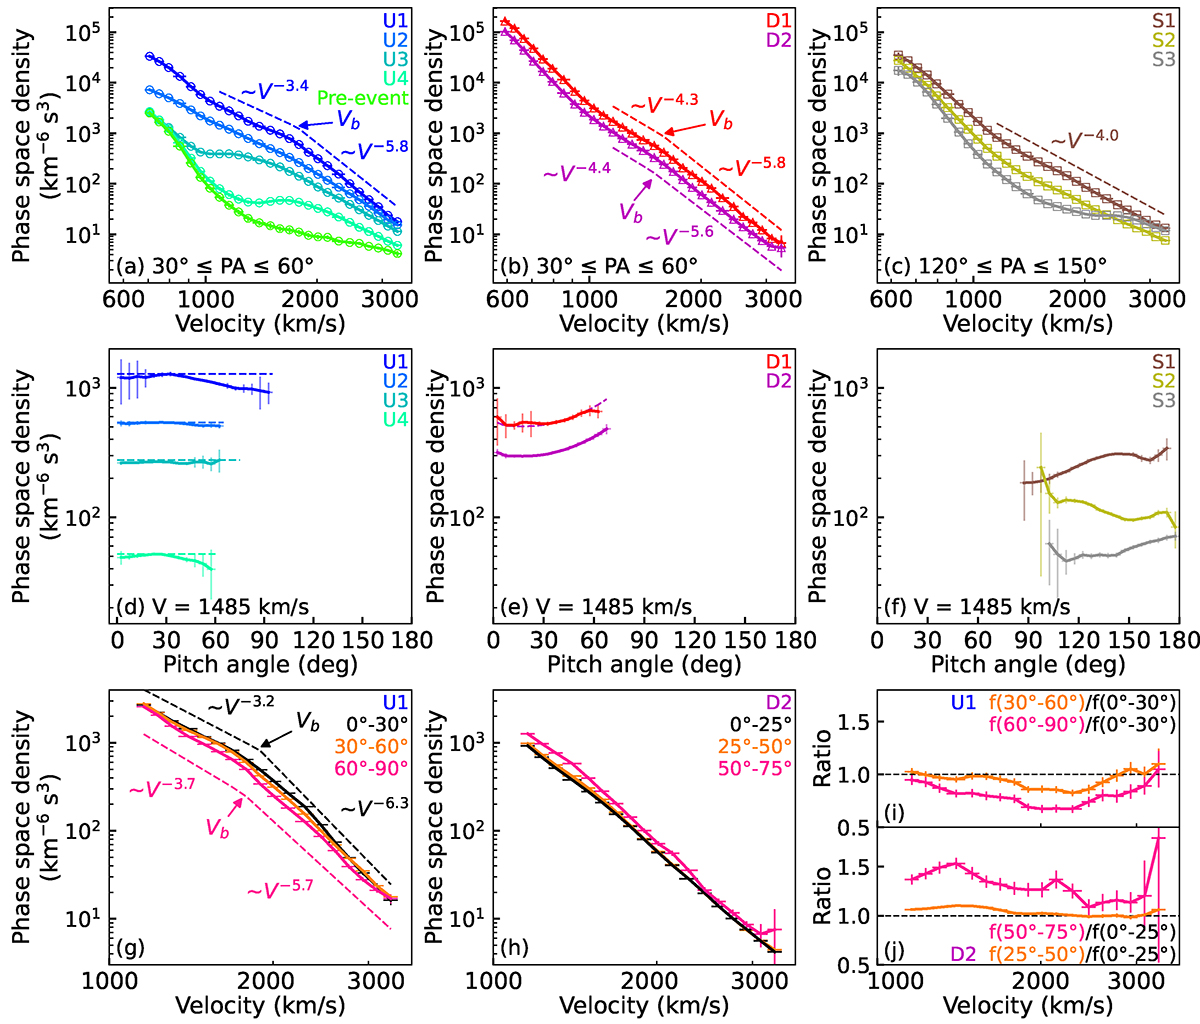
Fig. 4.
Download original image
VDFs and PADs averaged over the time intervals defined in Table 1. Panels a–c: phase space density at 30° ≤PA ≤ 60° upstream of the shock (a), at 30° ≤PA ≤ 60° downstream of the shock (b) and at 120° ≤PA ≤ 150° in a special downstream region (c) vs. proton velocity in the SWF. The dashed lines indicate the spectral shapes of the single or double power law fit to the spectra in the same colors. Vb indicates the break of the double power law. Panels d–f: phase space density at ∼1485 km s−1 vs. PA in the SWF. The dashed lines in panel d mark the maximum values of the corresponding solid lines, while the purple dashed line in panel e indicates the purple solid line multiplied by 1.7 in order to be compared with the solid red line. Panels g and h: phase space density in three different PA directions vs. velocity in the SWF for time intervals U1 and D1. Panels i and j: ratio of the phase space density between different PA directions vs. velocity in the SWF for time intervals U1 and D1. The colors indicate different time intervals in panels a–f, but different PA directions in panels g–j. The uncertainties are plotted as vertical or horizontal bars. The background caused by the penetrating particles has been removed.
Current usage metrics show cumulative count of Article Views (full-text article views including HTML views, PDF and ePub downloads, according to the available data) and Abstracts Views on Vision4Press platform.
Data correspond to usage on the plateform after 2015. The current usage metrics is available 48-96 hours after online publication and is updated daily on week days.
Initial download of the metrics may take a while.