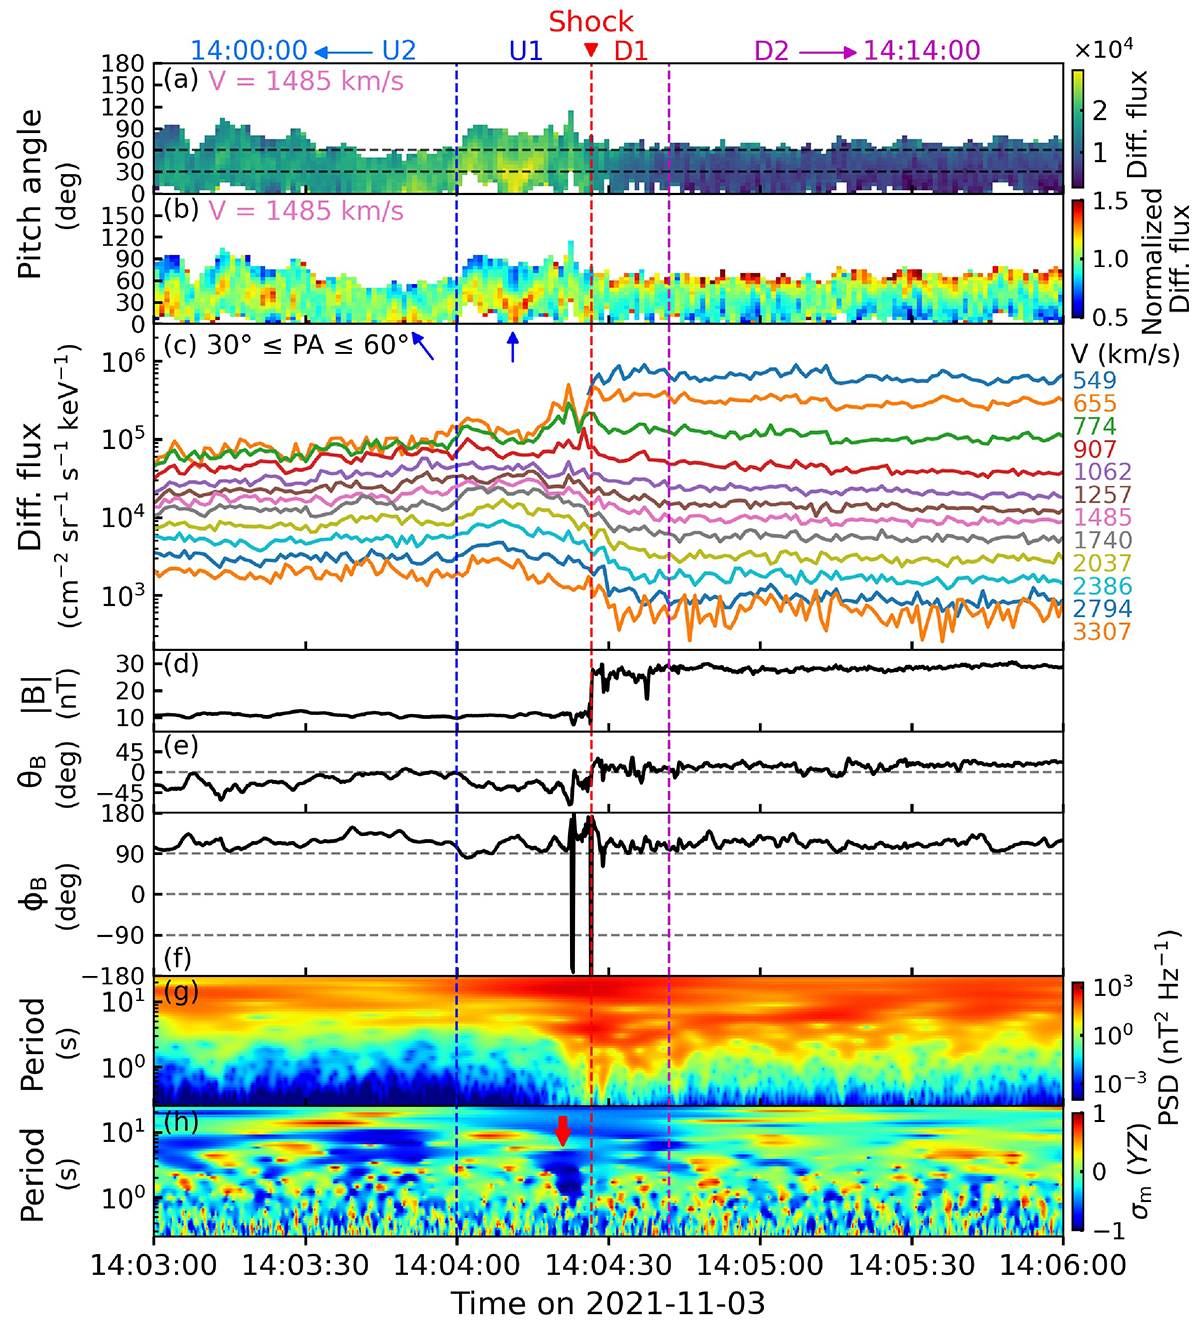
Fig. 3.
Download original image
Summary plot in the 3-min vicinity of the 2021 November 3 shock. Panels a–f: same as Fig. 2, but on a smaller timescale. Panel g: spectrogram of the trace power spectral density of the magnetic field fluctuations, obtained from the wavelet analysis (Torrence & Compo 1998). Panel h: spectrogram of the reduced magnetic helicity, σm, on the YZ plane of the spacecraft frame (He et al. 2011). If a wave vector points along +X (toward the Sun), positive σm (red) indicates right-hand polarization, and negative σm (blue) indicates left-hand polarization, and vice versa. The vertical dashed red line marks the shock front. The ∼26-s upstream interval bounded by the dashed blue line and the shock front is labeled U1. The ∼15-s downstream interval bounded by the shock front and the dashed purple line is labeled D1.
Current usage metrics show cumulative count of Article Views (full-text article views including HTML views, PDF and ePub downloads, according to the available data) and Abstracts Views on Vision4Press platform.
Data correspond to usage on the plateform after 2015. The current usage metrics is available 48-96 hours after online publication and is updated daily on week days.
Initial download of the metrics may take a while.