Fig. 2.
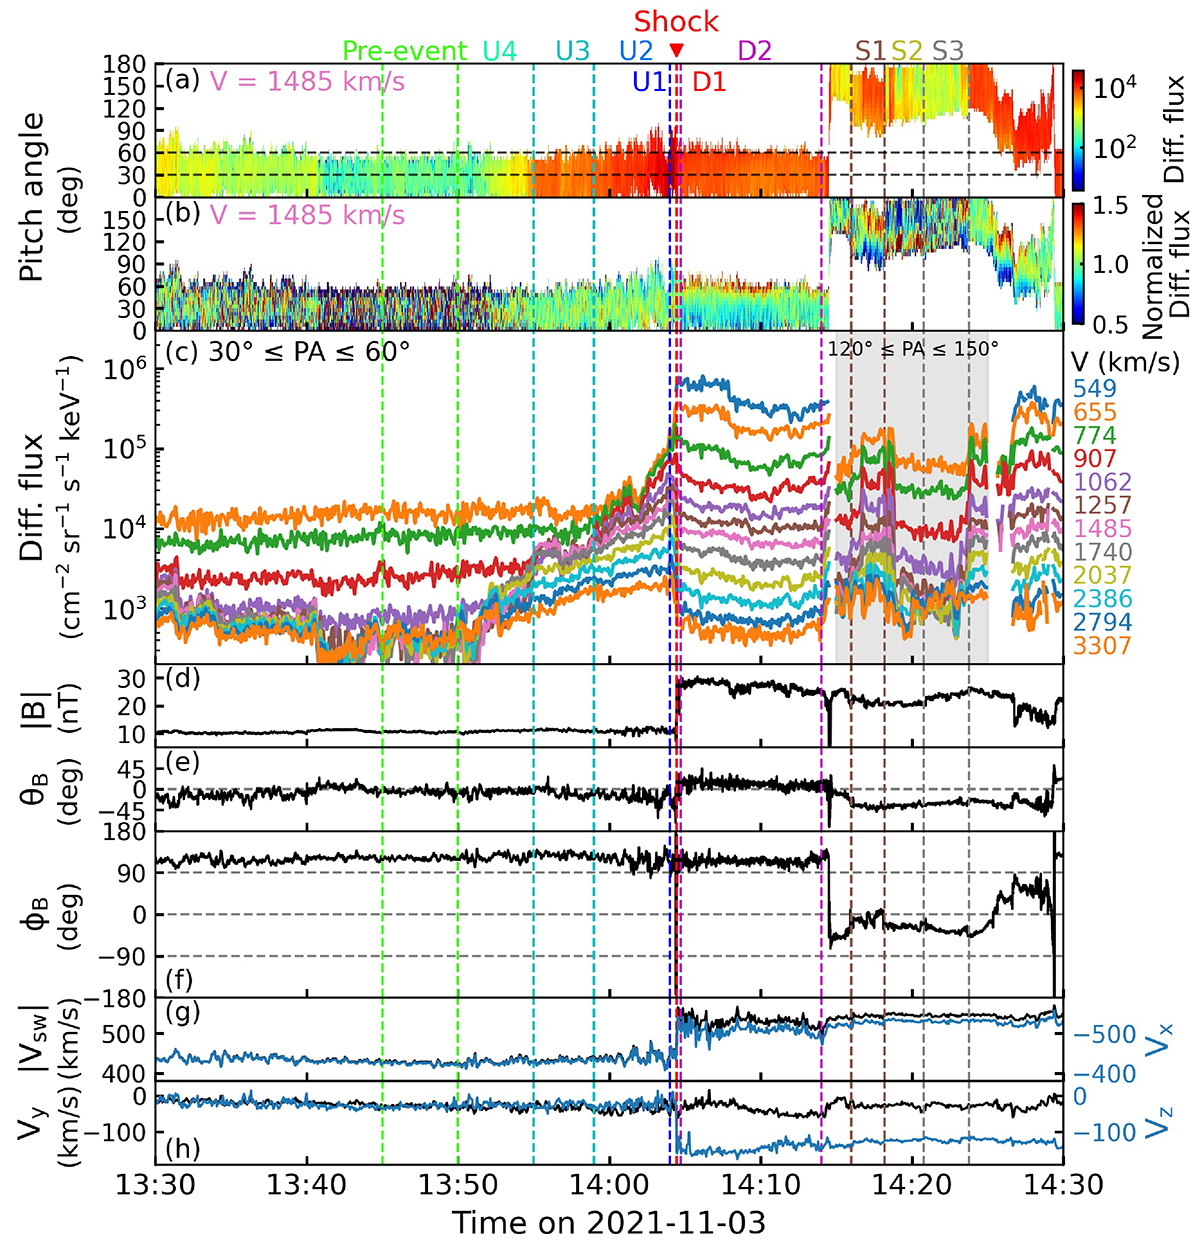
Download original image
Summary plot of the 2021 November 3 shock event. (a) PAD spectrogram of the ∼1485 km s−1 protons in the SWF. (b) Same PAD spectrogram as in panel a, but normalized by the flux averaged over all PAs for each time bin. (c) Differential flux vs. time of ∼500 − 3600 km s−1 protons traveling at 30° −60° PA (between the horizontal dashed lines in panel a). The shaded region at 14:15–14:25 shows the differential flux of protons traveling at 120° −150° PA. To improve the counting statistics, the 32 velocity bins are grouped into 12 logarithmically spaced bins, and their center velocities are shown on the right of the panel. Panels d–f: magnitude |B|, elevation angle θB, and azimuthal angle ϕB of the IMF. Panels g and h: solar wind proton bulk speed |Vsw| and the three components Vx, Vy, and Vz measured in the spacecraft frame. The vertical dashed red line marks the shock arrival. The other vertical dashed lines bound several selected intervals with the labels at the top, which are analyzed in Fig. 4.
Current usage metrics show cumulative count of Article Views (full-text article views including HTML views, PDF and ePub downloads, according to the available data) and Abstracts Views on Vision4Press platform.
Data correspond to usage on the plateform after 2015. The current usage metrics is available 48-96 hours after online publication and is updated daily on week days.
Initial download of the metrics may take a while.