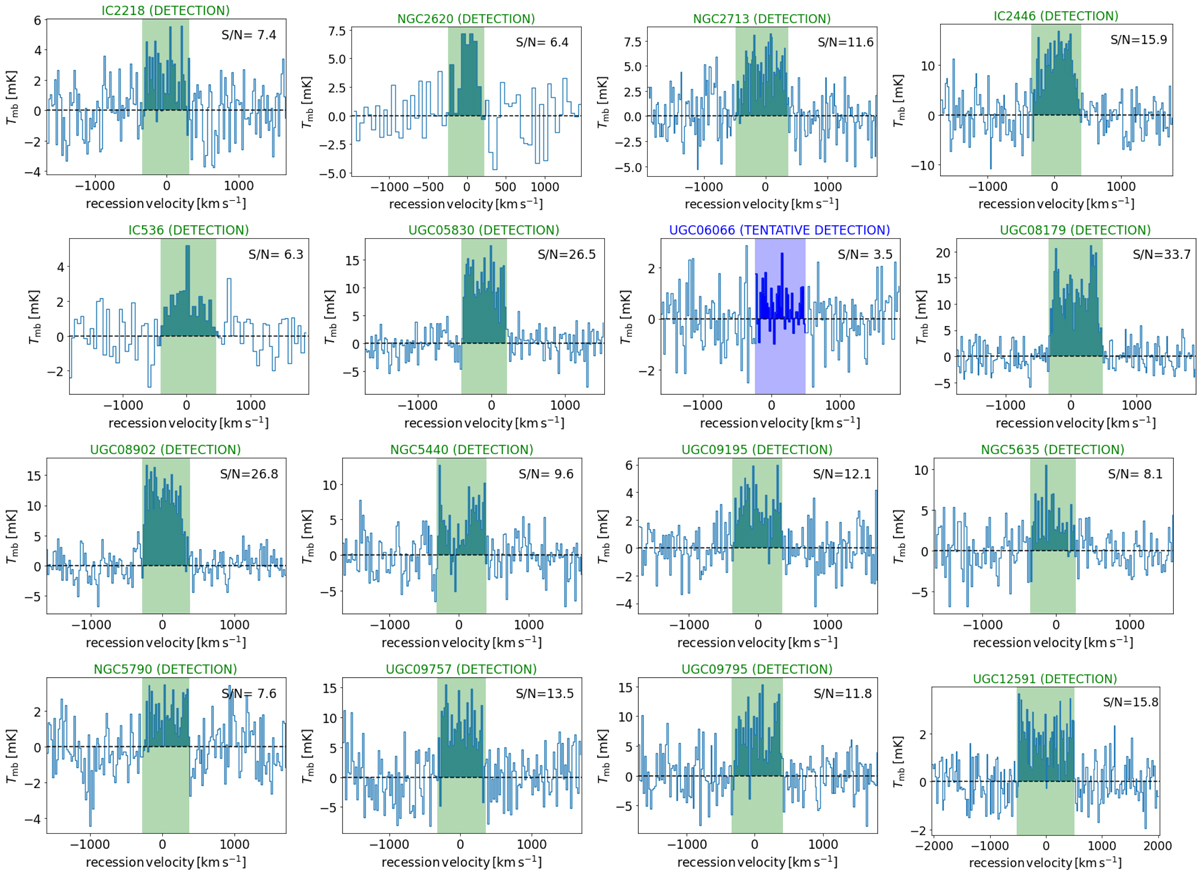
Fig. A.2.
Download original image
Observed spectra of the HI-FR galaxies. The signal-to-noise ratio S/N = ICO/error(ICO) is indicated in the upper left corner. The velocity resolution is 20 km s−1 for objects with S/N ≳ 7 and 50 km s−1 for objects with S/N ≲ 7. The x-axis gives the velocity relative to the (optical) recession velocity, vrec = cz, where z is the SLOAN redshift. The coloured shaded area represents the region over which the line is integrated to determine the total flux. The spectra are for the central emission, except for NGC 2713, NGC 5790, UGC 08902 and UGC 12591 for which the spectrum averaged over the positions along the major axis are shown.
Current usage metrics show cumulative count of Article Views (full-text article views including HTML views, PDF and ePub downloads, according to the available data) and Abstracts Views on Vision4Press platform.
Data correspond to usage on the plateform after 2015. The current usage metrics is available 48-96 hours after online publication and is updated daily on week days.
Initial download of the metrics may take a while.