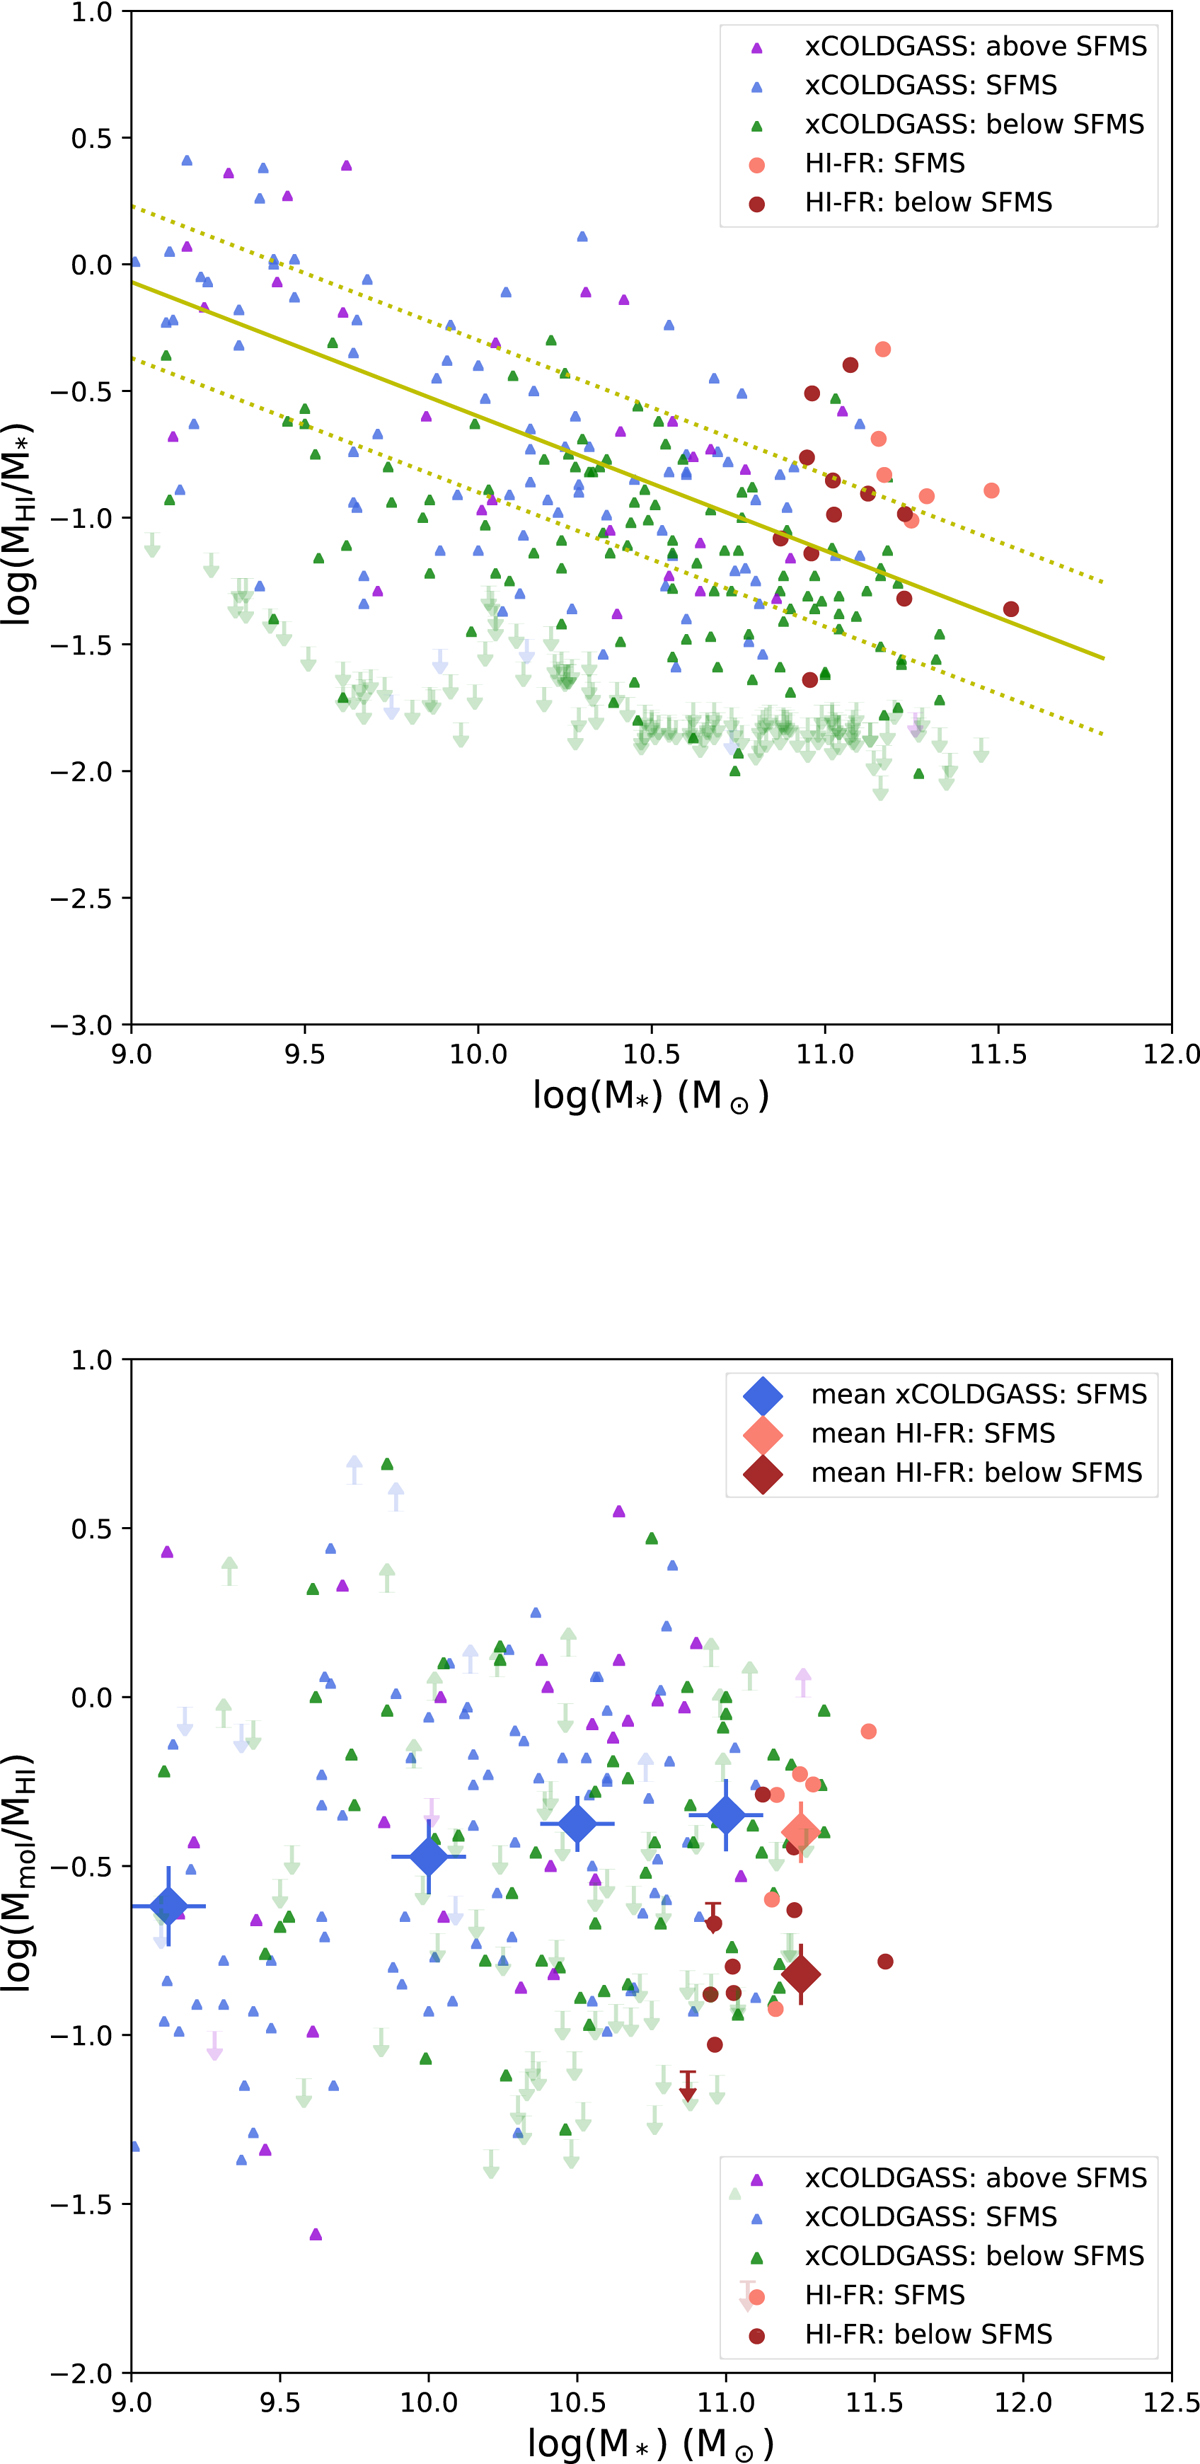
Fig. 11.
Download original image
Atomic gas mass fraction (upper panel) and the molecular-to-atomic mass ratio (lower panel) as a function of stellar mass for the HI-FR and the xCOLDGASS sample. The mean values of the HI-FR and of the different xCOLDGASS samples are indicated as diamonds, with the length of the vertical bar indicating the error of the mean, and the length of the horizontal bar the width of the chosen mass interval. Only galaxies with detections in HI are considered for the mean value of MHI/Mmol. The yellow line in the upper panel indicates the scaling relation found by Janowiecki et al. (2020) together with the 0.3 dex width adopted by these authors to characterize the HI main sequence.
Current usage metrics show cumulative count of Article Views (full-text article views including HTML views, PDF and ePub downloads, according to the available data) and Abstracts Views on Vision4Press platform.
Data correspond to usage on the plateform after 2015. The current usage metrics is available 48-96 hours after online publication and is updated daily on week days.
Initial download of the metrics may take a while.