Fig. 10.
Download original image
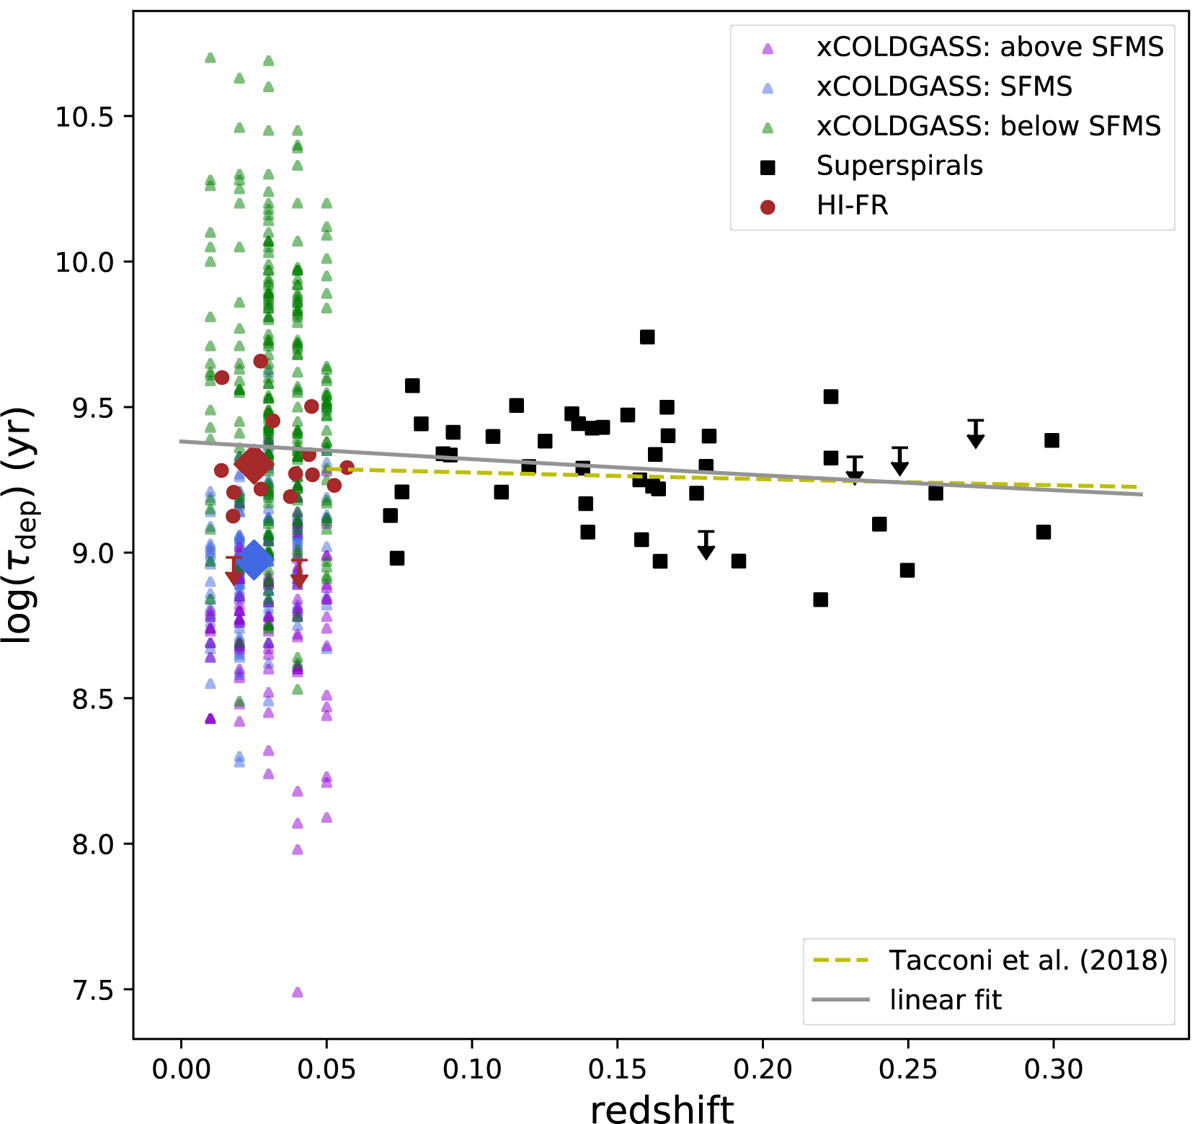
Gas depletion time τdep = Mmol/SFR as a function of redshift for the SS, HI-FR and the COLDGASS sample. The yellow line gives, for illustration, the relation of τdep ∝ (1 − z)−0.6 from Tacconi et al. (2018), and the gray line is the fit to our data (τdep ∝ (1 − z)−0.02). The blue diamond is the mean value of the xCOLDGASS galaxies that lie on the SFMS and the brown diamond is the mean value of the HI-FR sample. The errors of both means are smaller than the symbol size.
Current usage metrics show cumulative count of Article Views (full-text article views including HTML views, PDF and ePub downloads, according to the available data) and Abstracts Views on Vision4Press platform.
Data correspond to usage on the plateform after 2015. The current usage metrics is available 48-96 hours after online publication and is updated daily on week days.
Initial download of the metrics may take a while.