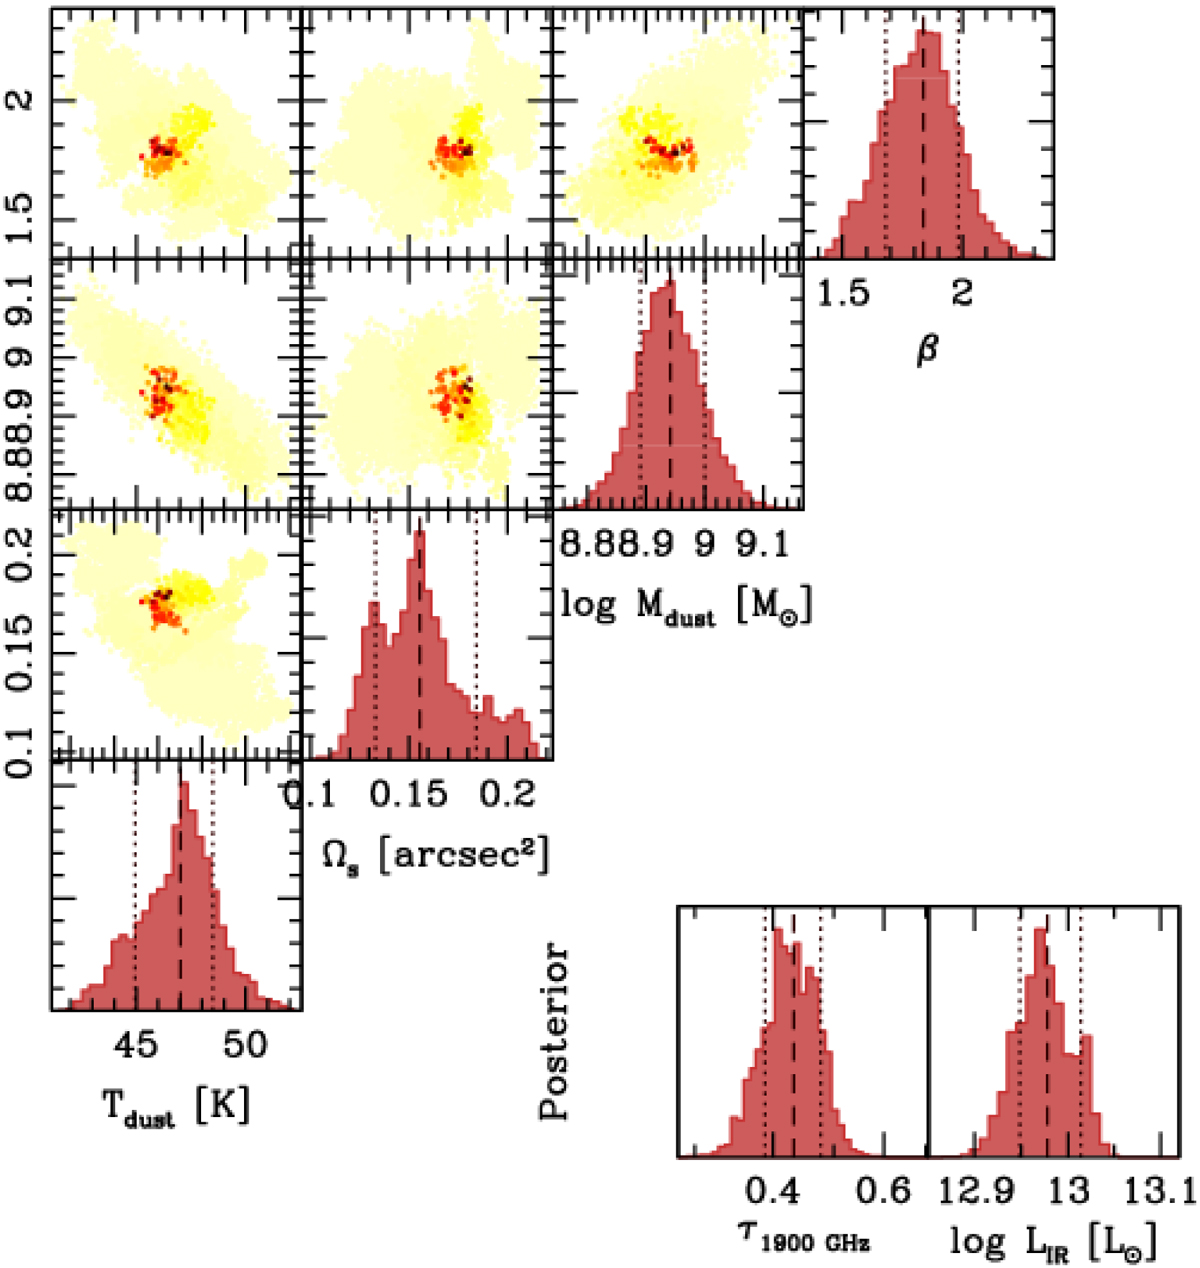
Fig. 3.
Download original image
Corner-plot posterior distributions for the parameters used in the dust SED modeling: the dust temperature, Tdust; the observed solid angle of the emitting region, Ωs; the mass of dust, Mdust; and the dust emissivity index, β. In the corner plots, darker points show values corresponding to higher posterior probabilities. We also show the marginalized posterior distributions for the dust optical depth at the frequency of [C II], τ1900 GHz; and of the infrared luminosity, LIR. In all the marginalized distributions, the median values are marked with a dashed line, and the values corresponding to the 1-σ confidence intervals are marked with dotted vertical lines.
Current usage metrics show cumulative count of Article Views (full-text article views including HTML views, PDF and ePub downloads, according to the available data) and Abstracts Views on Vision4Press platform.
Data correspond to usage on the plateform after 2015. The current usage metrics is available 48-96 hours after online publication and is updated daily on week days.
Initial download of the metrics may take a while.