Fig. A.1.
Download original image
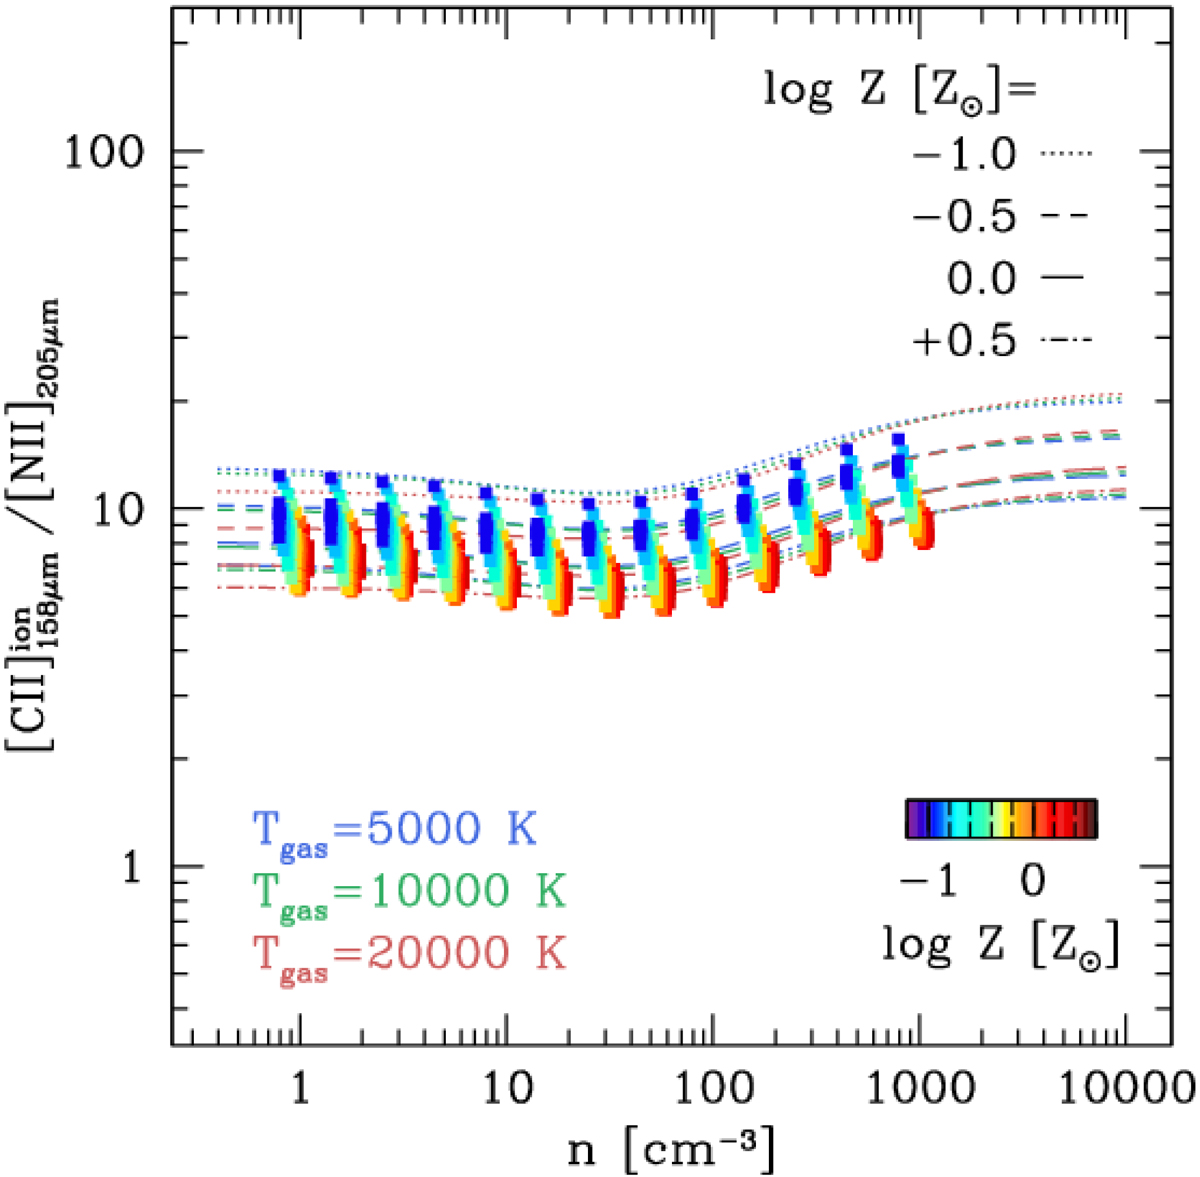
Luminosity ratio between the [C II] luminosity arising from the ionized medium only, [C II]![]() , and the [N II]205 μm line luminosity, as a function of the ionized gas density, n. Colored squares mark the results of our Cloudy models, color-coded by the gas metallicity. The models were performed on a grid of 0.25 dex spaced in log n, and slightly horizontally displaced in the plot for the sake of clarity. We also show our analytical predictions for the same line ratio, color-coded by the gas temperature, Tgas. Dotted, short-dashed, long-dashed, and dot-dashed lines mark models at increasing gas metallicity. The predicted line ratio is unaltered by Tgas, and is only slightly dependent on n, whereas it is linearly dependent on the relative abundance of carbon and nitrogen ions, [C+/N+].
, and the [N II]205 μm line luminosity, as a function of the ionized gas density, n. Colored squares mark the results of our Cloudy models, color-coded by the gas metallicity. The models were performed on a grid of 0.25 dex spaced in log n, and slightly horizontally displaced in the plot for the sake of clarity. We also show our analytical predictions for the same line ratio, color-coded by the gas temperature, Tgas. Dotted, short-dashed, long-dashed, and dot-dashed lines mark models at increasing gas metallicity. The predicted line ratio is unaltered by Tgas, and is only slightly dependent on n, whereas it is linearly dependent on the relative abundance of carbon and nitrogen ions, [C+/N+].
Current usage metrics show cumulative count of Article Views (full-text article views including HTML views, PDF and ePub downloads, according to the available data) and Abstracts Views on Vision4Press platform.
Data correspond to usage on the plateform after 2015. The current usage metrics is available 48-96 hours after online publication and is updated daily on week days.
Initial download of the metrics may take a while.