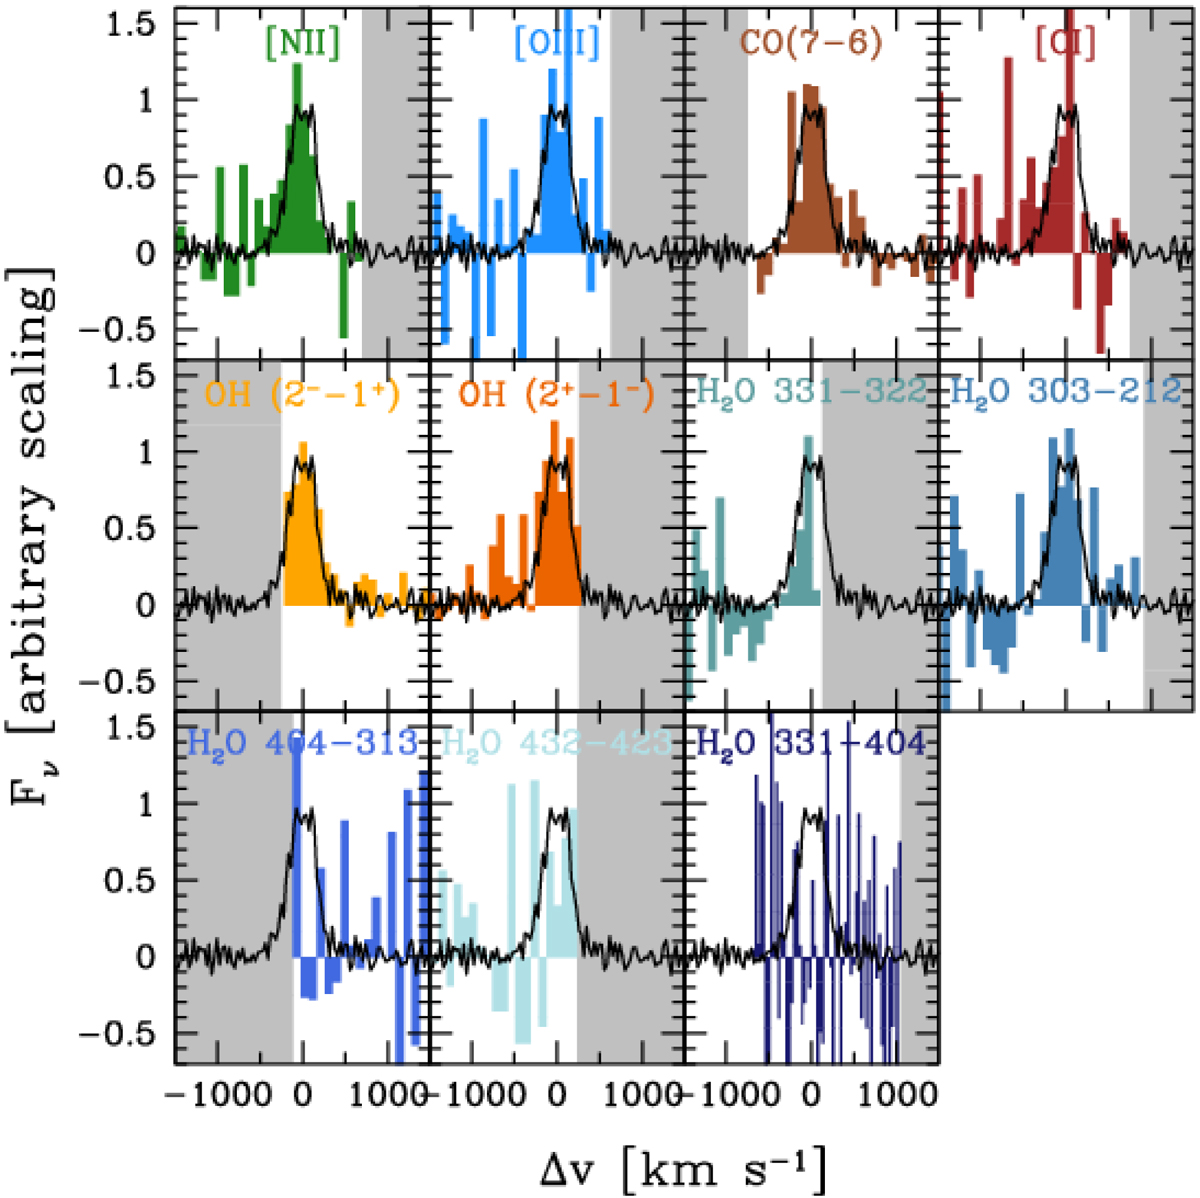
Fig. 11.
Download original image
Comparison between the line profiles of the main transitions in our study (shaded histograms) and the [C II] line profile (black histograms). The grey shading masks regions that are not covered within our observations or are contaminated by other emission lines. To first order, all the lines appear to have a consistent bulk velocity and width. A tentative H2O absorption is detected at −750 km s−1 in the 3(3,1)–3(2,2) and 3(0,3)–2(1,2) transitions, suggesting the presence of an outflow.
Current usage metrics show cumulative count of Article Views (full-text article views including HTML views, PDF and ePub downloads, according to the available data) and Abstracts Views on Vision4Press platform.
Data correspond to usage on the plateform after 2015. The current usage metrics is available 48-96 hours after online publication and is updated daily on week days.
Initial download of the metrics may take a while.