Fig. 7.
Download original image
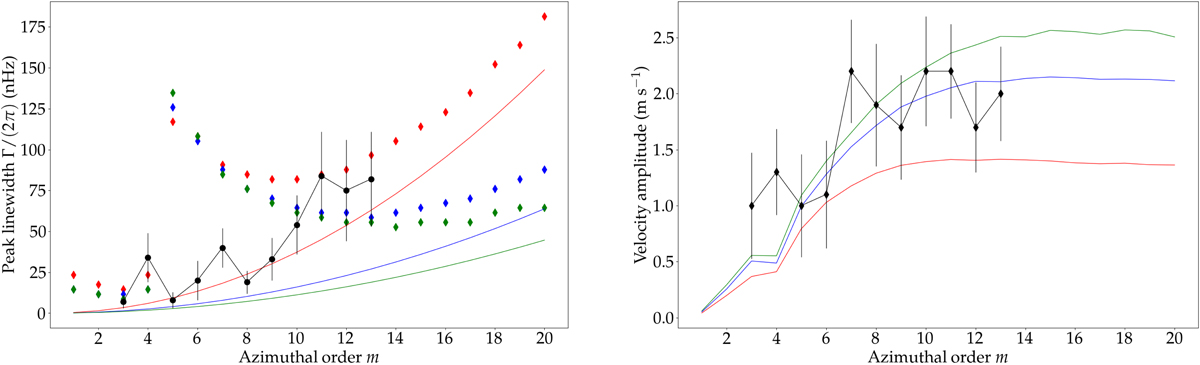
Equatorial Rossby mode parameters. Left: full width at half maximum of the resonant peaks that could be identified as equatorial Rossby modes, as a function of m. The diamonds show the linewidths measured in the uy equatorial synthetic power spectrum, and the coloured solid lines represent the theoretical Rossby mode linewidth, obtained from the classical dispersion relation ![]() (see Eq. (60)). The colour code refers to the value of the turbulent Reynolds number: Returb = 300 (red), 700 (blue), and 1000 (green). The black line shows the mode linewidths inferred from solar observations at the equator in the latitudinal velocity spectrum, as reported by Liang et al. (2019). Error bars from the fitting procedure reported by the authors are also shown. Right: Rossby mode amplitude (coloured solid lines) in the uy equatorial synthetic power spectra, as a function of azimuthal order m, defined as described in the text (see Eq. (58)). The colour code is identical to the one in the left panel.
(see Eq. (60)). The colour code refers to the value of the turbulent Reynolds number: Returb = 300 (red), 700 (blue), and 1000 (green). The black line shows the mode linewidths inferred from solar observations at the equator in the latitudinal velocity spectrum, as reported by Liang et al. (2019). Error bars from the fitting procedure reported by the authors are also shown. Right: Rossby mode amplitude (coloured solid lines) in the uy equatorial synthetic power spectra, as a function of azimuthal order m, defined as described in the text (see Eq. (58)). The colour code is identical to the one in the left panel.
Current usage metrics show cumulative count of Article Views (full-text article views including HTML views, PDF and ePub downloads, according to the available data) and Abstracts Views on Vision4Press platform.
Data correspond to usage on the plateform after 2015. The current usage metrics is available 48-96 hours after online publication and is updated daily on week days.
Initial download of the metrics may take a while.