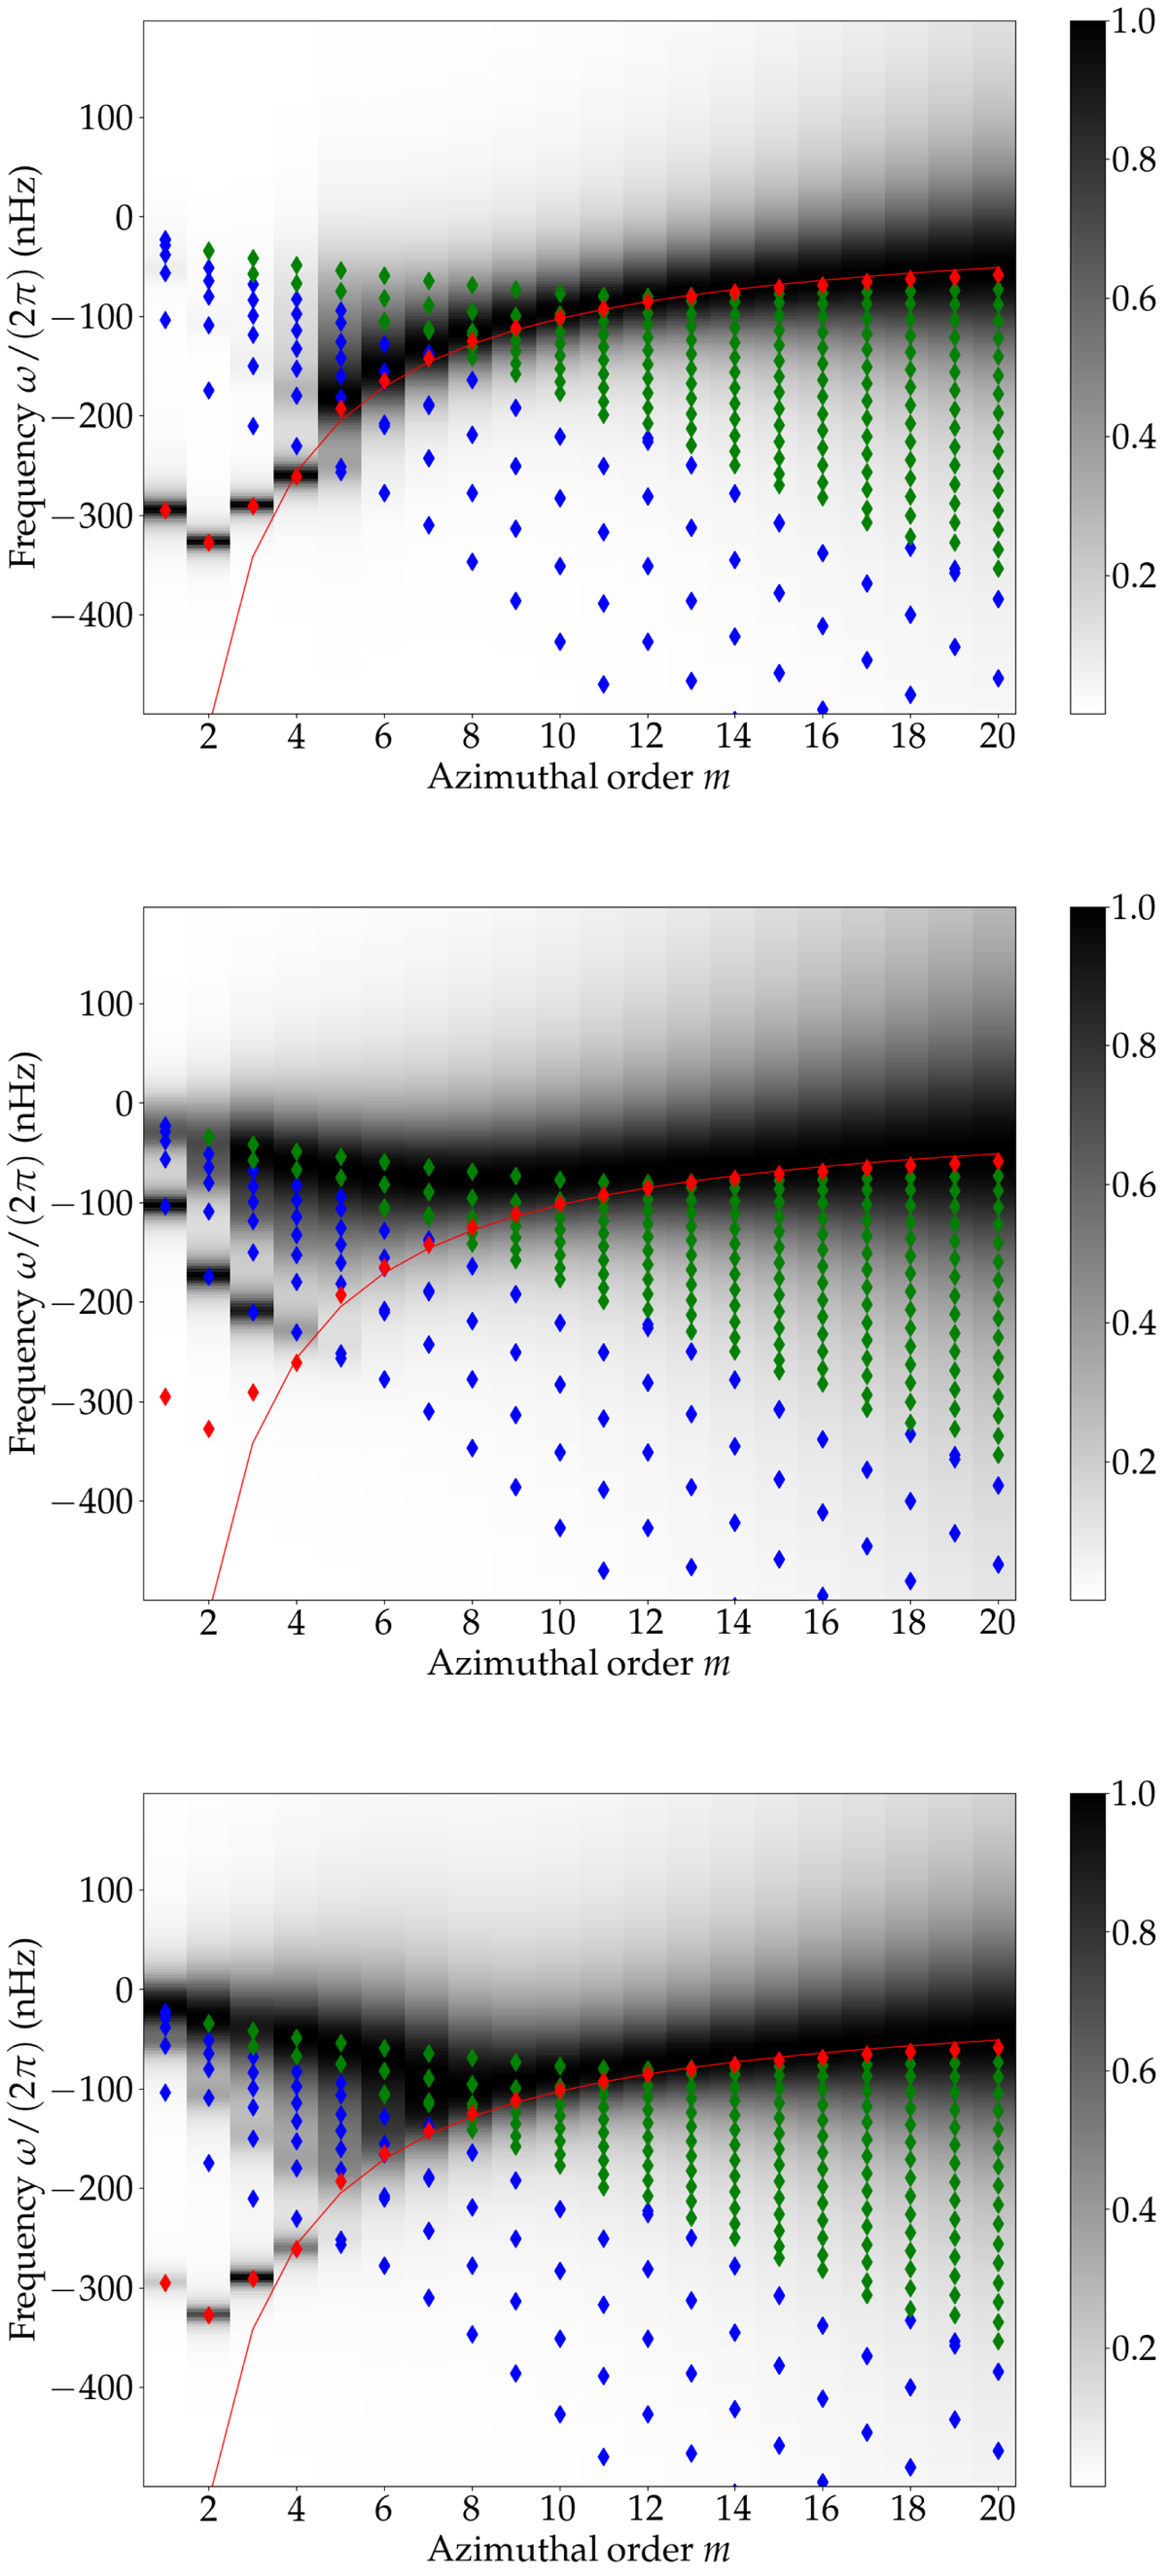
Fig. 6.
Download original image
Synthetic equatorial spectrum in the m-ω plane, in terms of uy (top), ux (middle), and ζ (bottom). Each vertical slice is normalised separately such that the maximum is unity. The diamonds show the real part of the eigenfrequencies of the linear homogeneous problem, computed as described in Sect. 3.1.1. The colour code refers to the mode categories: the blue diamonds represent the A branch, the green diamonds represent the P branch, and the red diamonds represent the Rossby modes (see Sect. 3.1.1 for a description of these branches). The solid red line shows the theoretical dispersion relation for sectoral Rossby modes in Cartesian coordinates (see Eq. (59)).
Current usage metrics show cumulative count of Article Views (full-text article views including HTML views, PDF and ePub downloads, according to the available data) and Abstracts Views on Vision4Press platform.
Data correspond to usage on the plateform after 2015. The current usage metrics is available 48-96 hours after online publication and is updated daily on week days.
Initial download of the metrics may take a while.