Fig. 3.
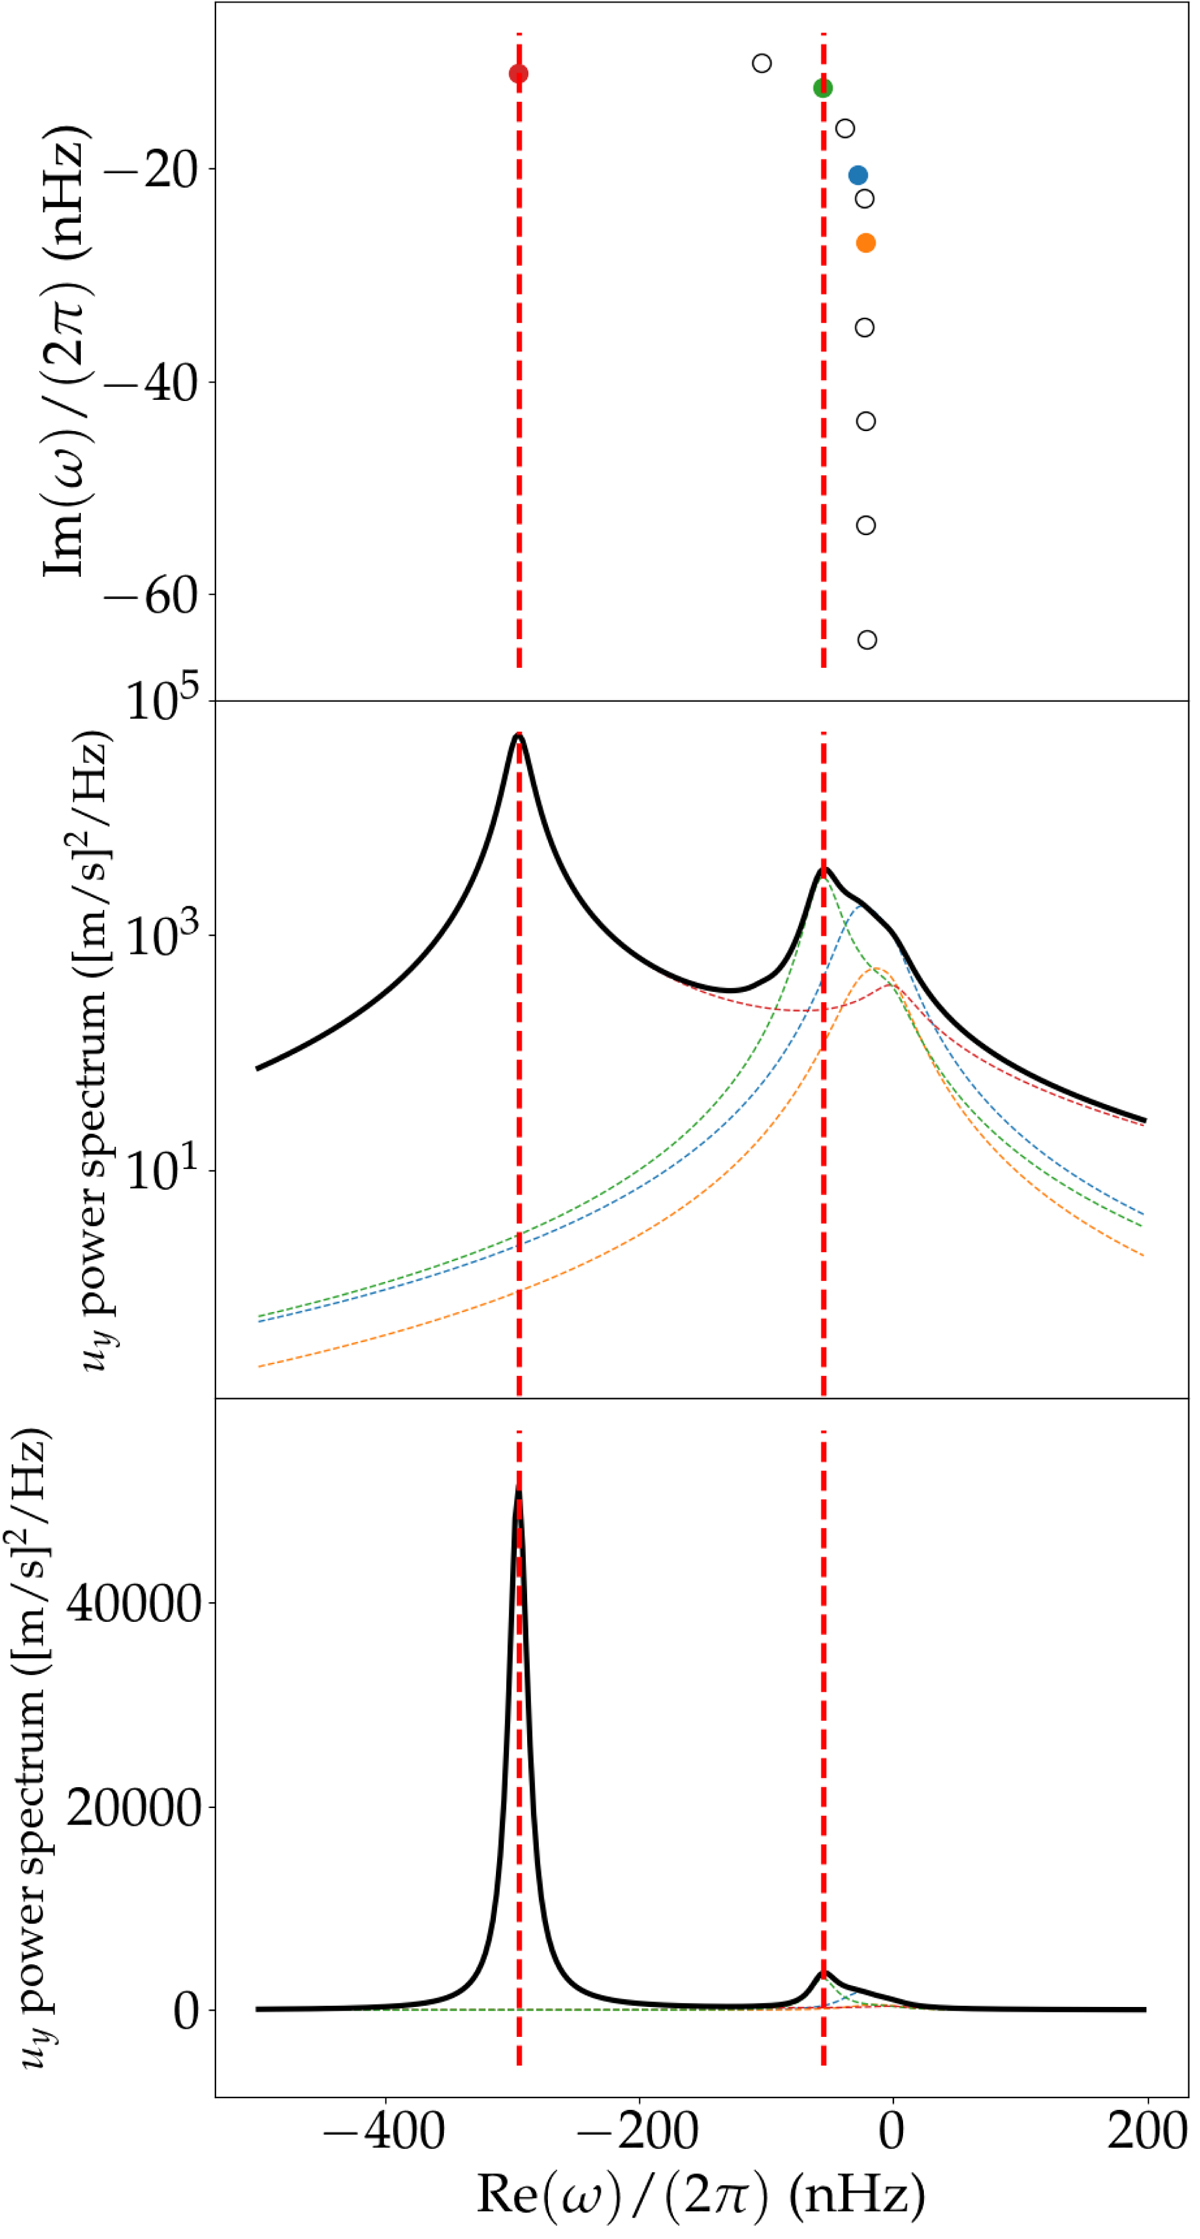
Download original image
Latitudinal velocity spectrum. Top: discrete inertial mode eigenspectrum for m = 3, shown in the complex plane. Each point correspond to one mode: all eigenfrequencies have a negative real part (meaning the modes are retrograde) and a negative imaginary part (meaning they are stable). The coloured dots mark the modes whose contribution to the uy spectrum is most prominent. The vertical dashed lines indicate the central frequencies of each resonant peak in the uy power spectrum (see bottom panel). Middle: equatorial uy spectrum, obtained from Eq. (16) for azimuthal order m = 3. The solid black line shows the total spectrum, while each coloured dashed line corresponds to the individual contribution of the normal eigenmodes of the system, as described in the main text. The colours of the dashed lines match the colour scheme of the top panel. The red vertical dashed lines show the local maxima of the total spectrum. Bottom: same as the middle panel, but the vertical scale is linear.
Current usage metrics show cumulative count of Article Views (full-text article views including HTML views, PDF and ePub downloads, according to the available data) and Abstracts Views on Vision4Press platform.
Data correspond to usage on the plateform after 2015. The current usage metrics is available 48-96 hours after online publication and is updated daily on week days.
Initial download of the metrics may take a while.