Fig. 2.
Download original image
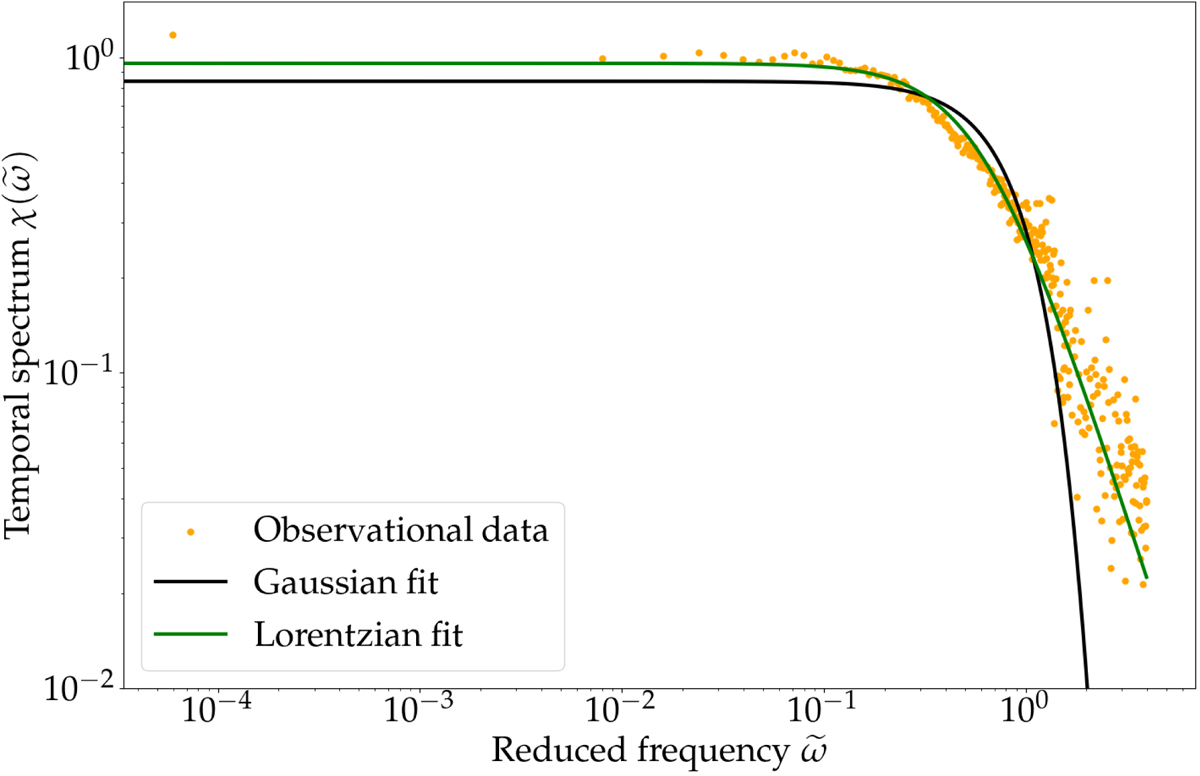
Temporal spectrum ![]() , as a function of the reduced frequency
, as a function of the reduced frequency ![]() . The data points (in orange) have been binned according to the value of
. The data points (in orange) have been binned according to the value of ![]() (which depends on both ω and k), and only the mean over each bin is shown. These data points collapse onto a unique, slowly varying curve, which was adjusted alternatively with a Gaussian function (Eq. (50), solid black line) and a Lorentzian function (Eq. (51), solid green line). The latter is clearly the best fit, obtained for an amplitude A = 1.85 and a standard deviation σ = 0.62.
(which depends on both ω and k), and only the mean over each bin is shown. These data points collapse onto a unique, slowly varying curve, which was adjusted alternatively with a Gaussian function (Eq. (50), solid black line) and a Lorentzian function (Eq. (51), solid green line). The latter is clearly the best fit, obtained for an amplitude A = 1.85 and a standard deviation σ = 0.62.
Current usage metrics show cumulative count of Article Views (full-text article views including HTML views, PDF and ePub downloads, according to the available data) and Abstracts Views on Vision4Press platform.
Data correspond to usage on the plateform after 2015. The current usage metrics is available 48-96 hours after online publication and is updated daily on week days.
Initial download of the metrics may take a while.