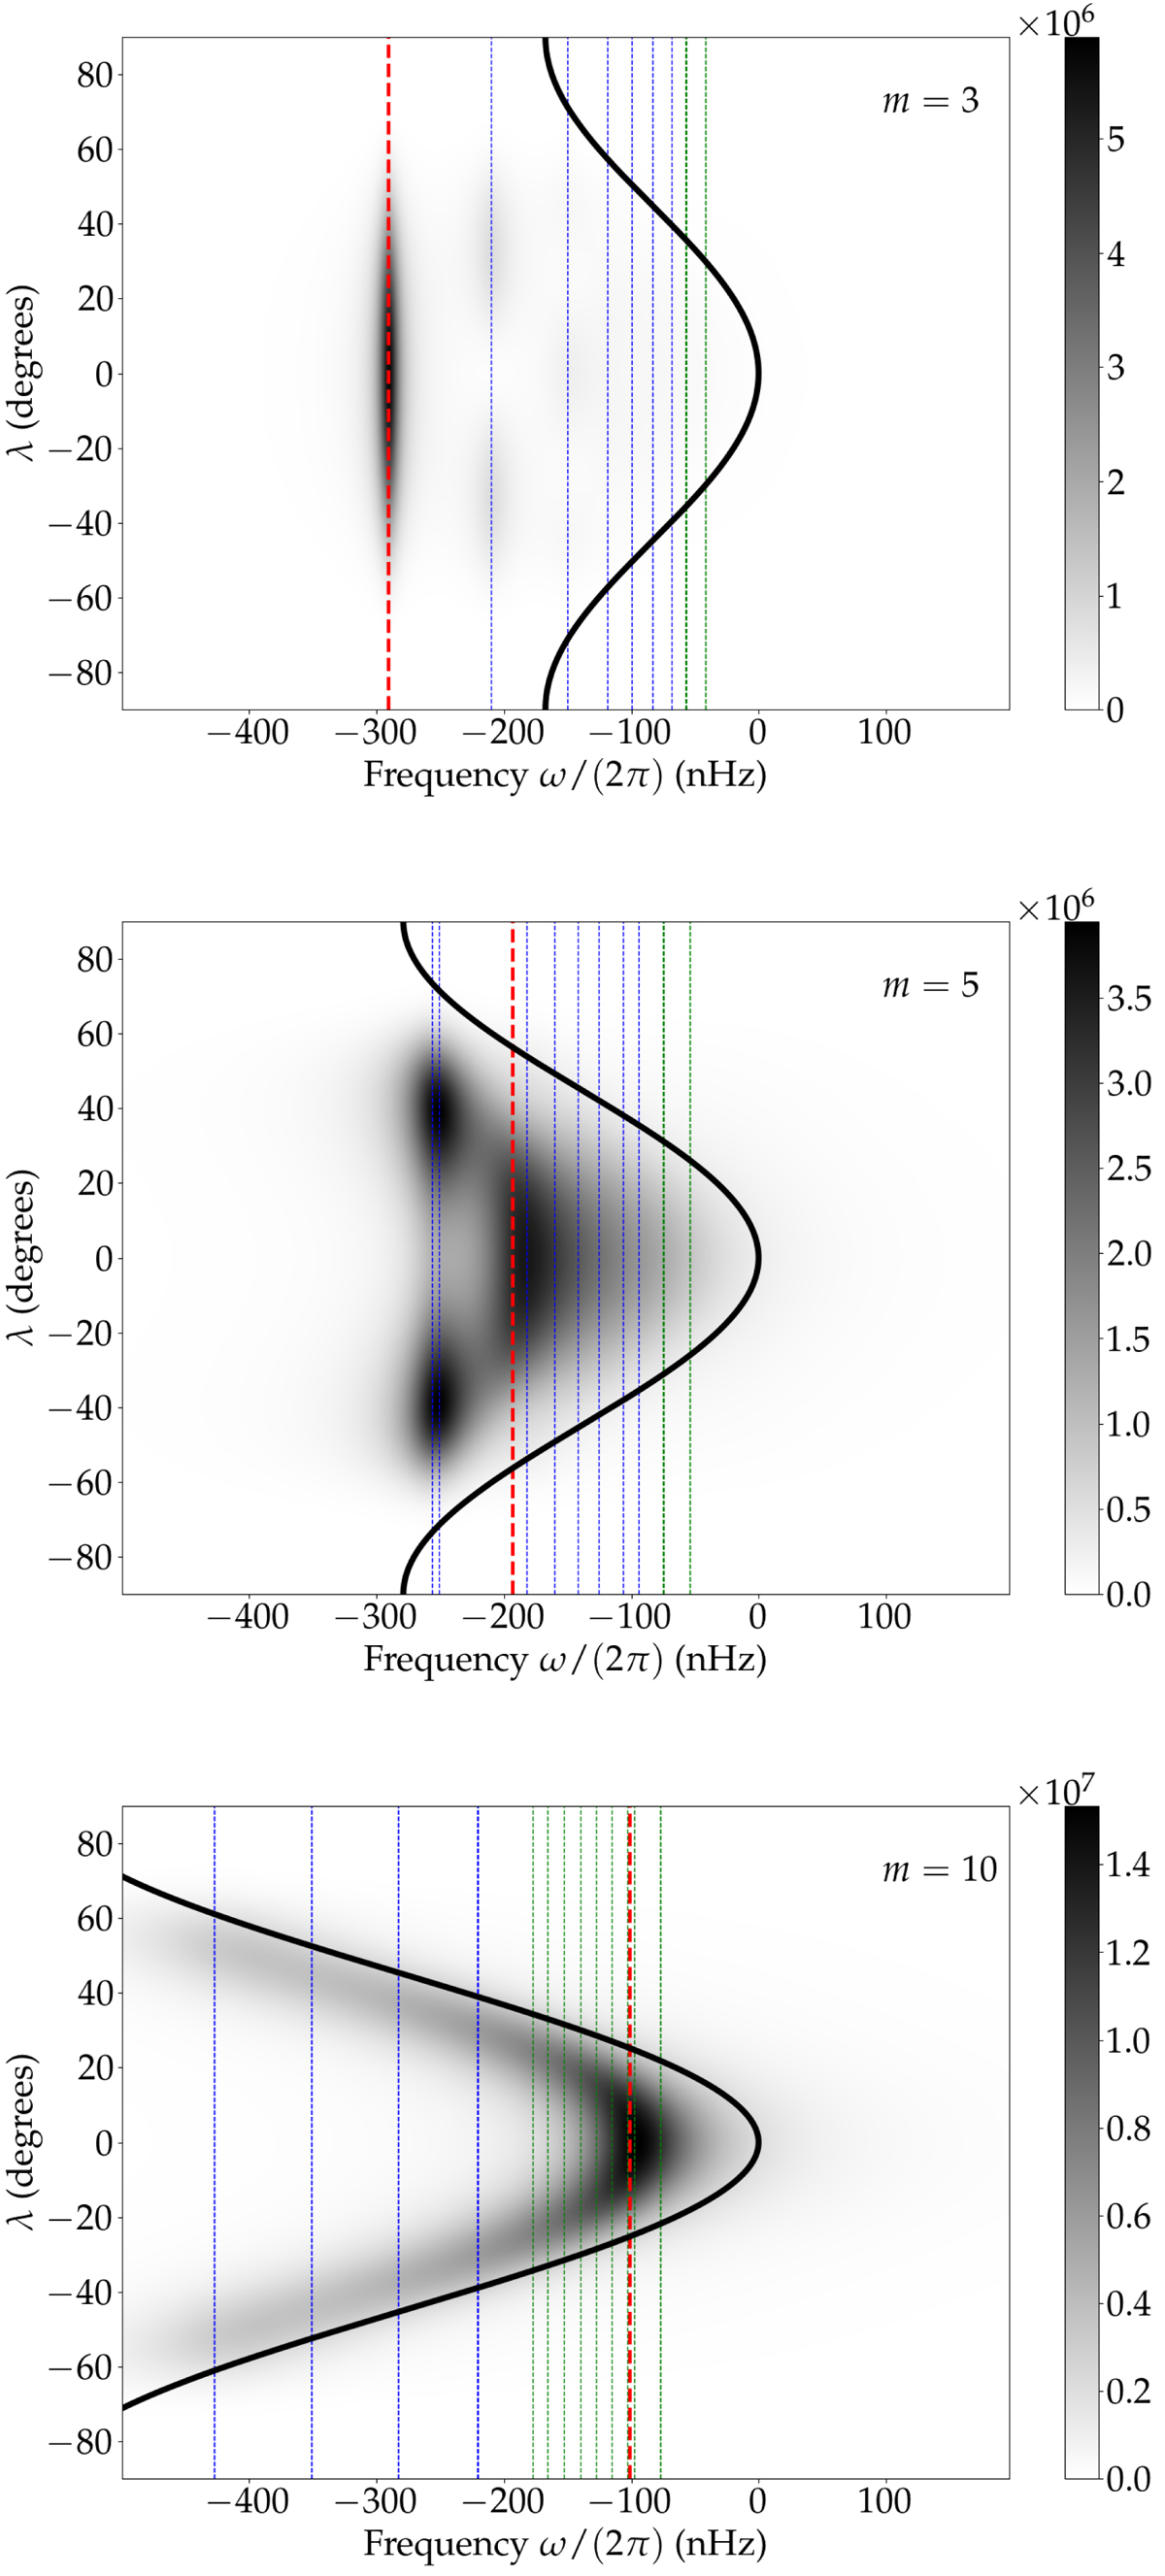
Fig. 10.
Download original image
Power spectrum of the latitudinal velocity, uy, as a function of frequency (horizontal axis) and latitude (vertical axis). Each panel corresponds to a different azimuthal order: m = 3 (top), m = 5 (middle), and m = 10 (bottom). The turbulent Reynolds number is set to Returb = 300. The solid black curve shows the critical latitudes, where the differential rotation exactly matches the phase velocity of the inertial waves, and is defined by the implicit relation Eq. (61). The dashed vertical lines show the real part of the eigenfrequencies of the homogeneous problem, with the same colour code as in Fig. 6.
Current usage metrics show cumulative count of Article Views (full-text article views including HTML views, PDF and ePub downloads, according to the available data) and Abstracts Views on Vision4Press platform.
Data correspond to usage on the plateform after 2015. The current usage metrics is available 48-96 hours after online publication and is updated daily on week days.
Initial download of the metrics may take a while.