Fig. B.4.
Download original image
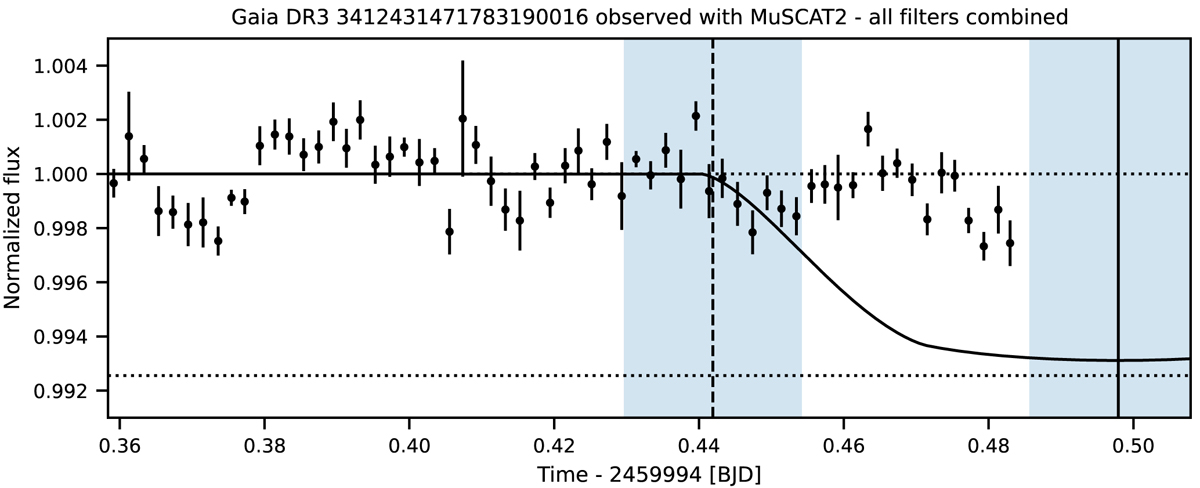
Light curve of Gaia DR3 3412431471783190016 covering the expected transit ingress observed with MuSCAT2. The dots with uncertainties show the MuSCAT2 observations, the solid line visualises the transit, the solid vertical line shows the expected transit center, and the slashed vertical line shows the expected beginning of the transit. The observations clearly show that the transit signal does not arise from Gaia DR3 3412431471783190016.
Current usage metrics show cumulative count of Article Views (full-text article views including HTML views, PDF and ePub downloads, according to the available data) and Abstracts Views on Vision4Press platform.
Data correspond to usage on the plateform after 2015. The current usage metrics is available 48-96 hours after online publication and is updated daily on week days.
Initial download of the metrics may take a while.