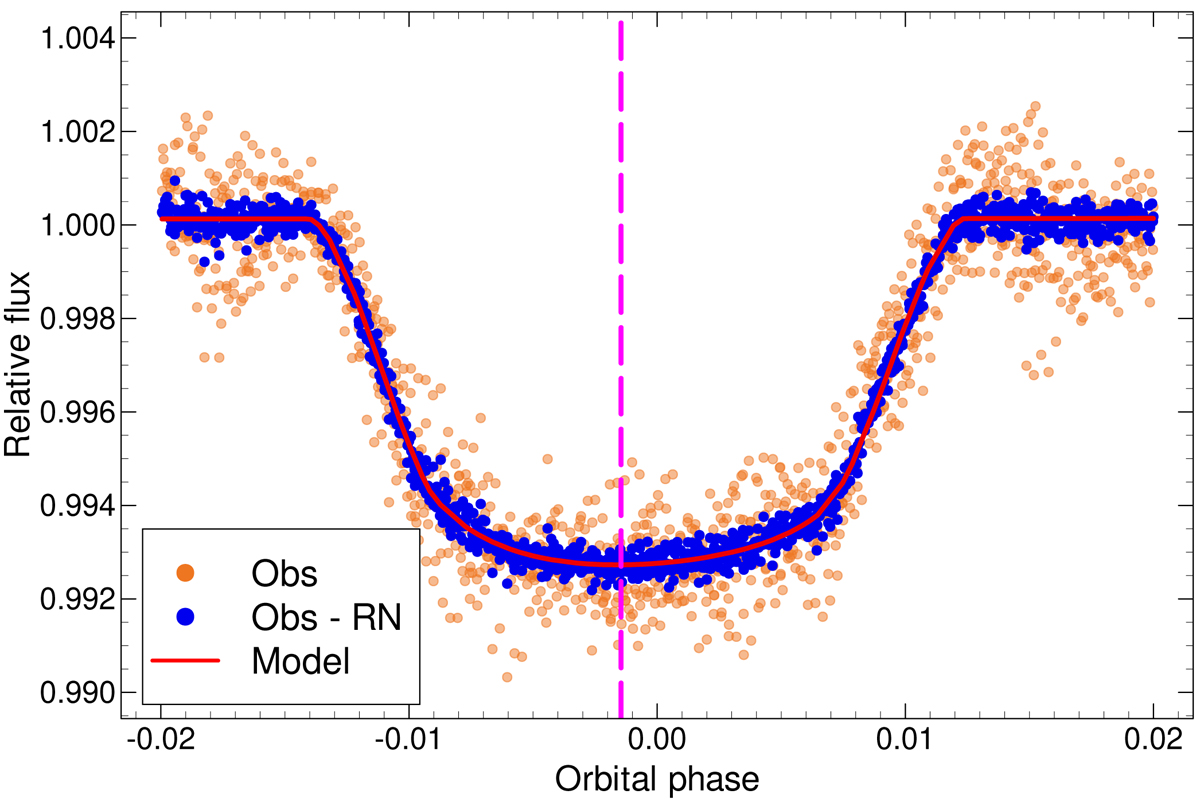
Fig. A.1.
Download original image
Phase folded, pre-cleaned light curve of HD 31221 b (orange dots), centered around the transit. Removing the correlated noise from the input LC yield the blue dots, while the solid red line represents the best-fit solution. The dashed magenta line is drawn at the minimum of the transit, which is shifted from 0.0 phase because of gravity darkening.
Current usage metrics show cumulative count of Article Views (full-text article views including HTML views, PDF and ePub downloads, according to the available data) and Abstracts Views on Vision4Press platform.
Data correspond to usage on the plateform after 2015. The current usage metrics is available 48-96 hours after online publication and is updated daily on week days.
Initial download of the metrics may take a while.