Fig. 3.
Download original image
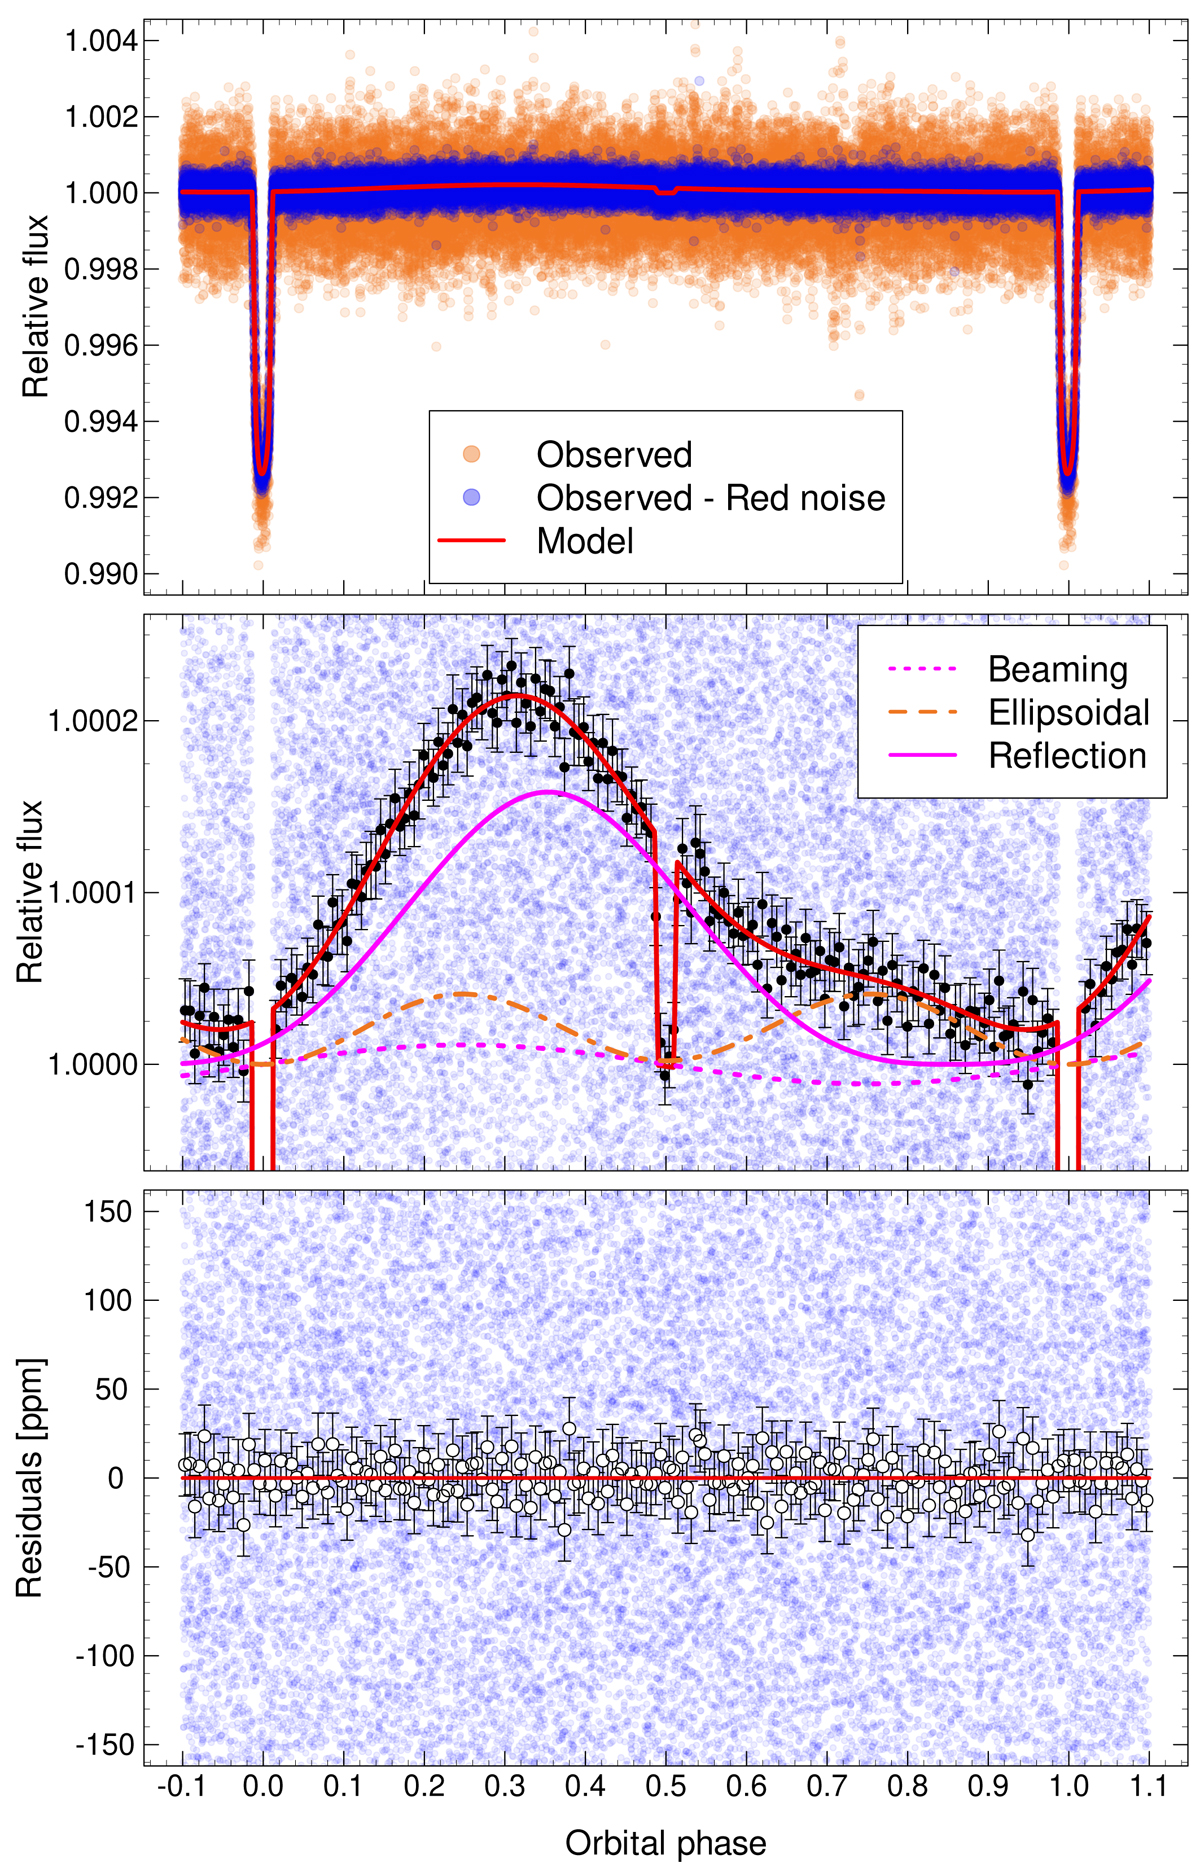
Phase-folded, pre-cleaned light curve of HD 31221 b (top panel, orange). The noise-corrected light curve is shown with blue dots on the top and middle panels. The solid red line represent the best-fit model. Black dots and the corresponding error bars of the middle panel represent 200-points bins. The out-of-transit variations are dominated by the reflection effect (middle panel, solid magenta line), but the ellipsoidal effect (dashed orange line, middle panel) and the Doppler-beaming (dashed magenta line, middle panel) are also detectable. The residuals are plotted on the bottom panel with a similar scale to the middle panel. White circles with black outlines represent the binned data residuals with the same binning as on the middle panel. The respective error bars are shown with black. The orange dots of the top panels represent the same LC as on the lower panel of Fig. 1.
Current usage metrics show cumulative count of Article Views (full-text article views including HTML views, PDF and ePub downloads, according to the available data) and Abstracts Views on Vision4Press platform.
Data correspond to usage on the plateform after 2015. The current usage metrics is available 48-96 hours after online publication and is updated daily on week days.
Initial download of the metrics may take a while.