Open Access
Fig. 1.
Download original image
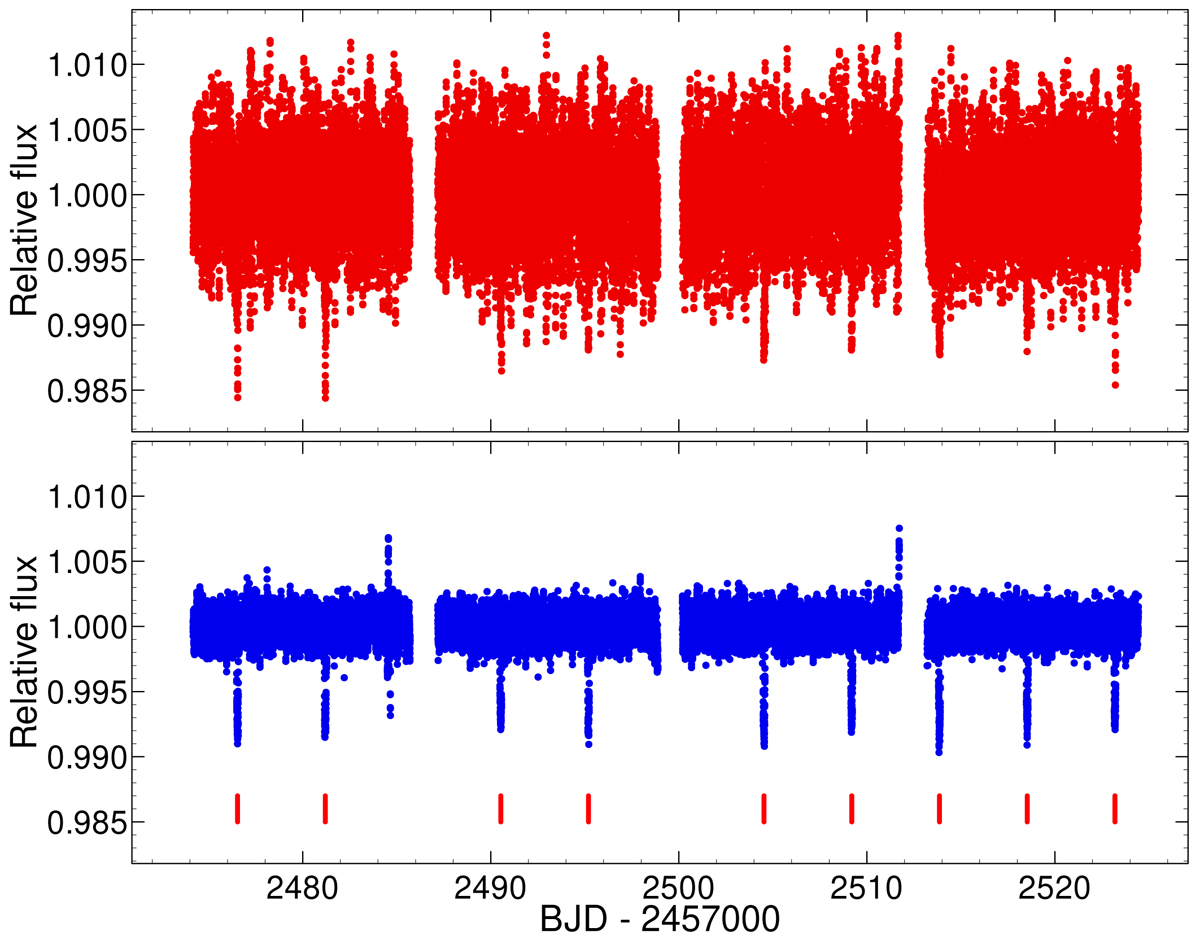
SAP lightcurve of HD 31221 (top panel). Removing the signal produced by the first 80 frequencies with the highest amplitudes from the raw LC yields the input light curve (bottom panel) to our fitting. The nine observed transits are marked by red ticks in the bottom panel.
Current usage metrics show cumulative count of Article Views (full-text article views including HTML views, PDF and ePub downloads, according to the available data) and Abstracts Views on Vision4Press platform.
Data correspond to usage on the plateform after 2015. The current usage metrics is available 48-96 hours after online publication and is updated daily on week days.
Initial download of the metrics may take a while.