Fig. 6
Download original image
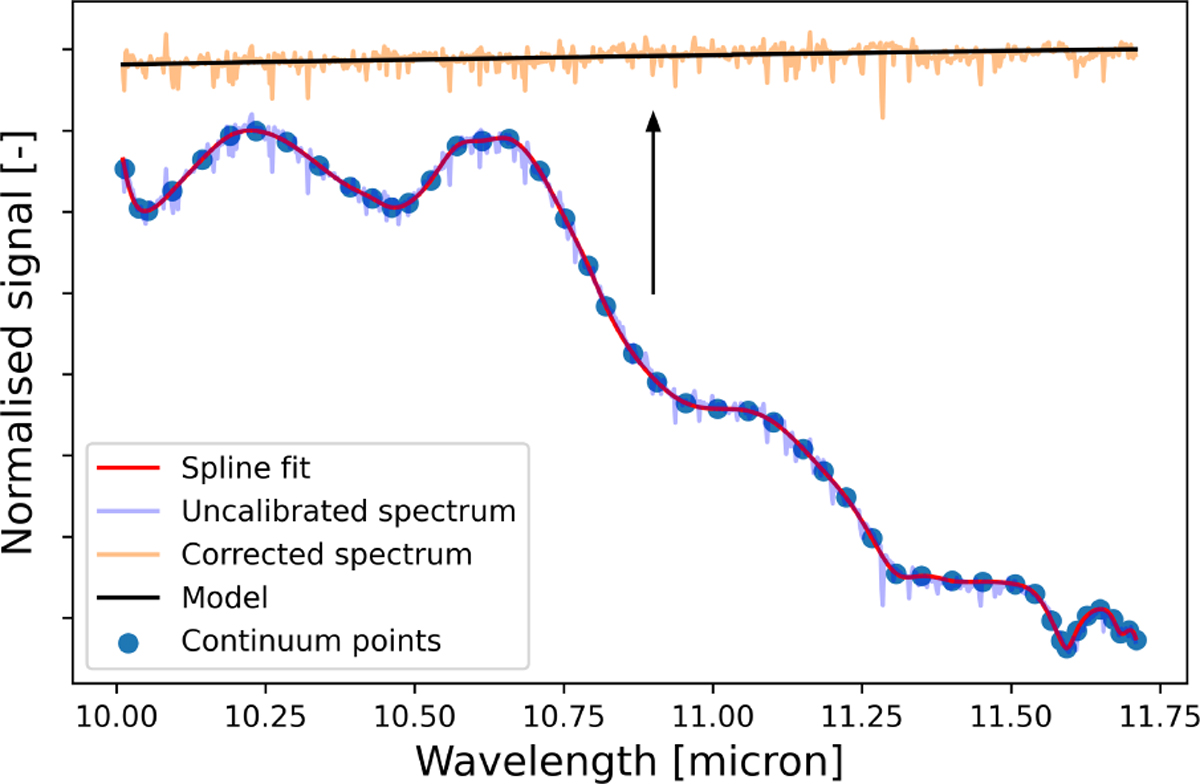
Illustration of derivation process of the new PHOTOM. This example shows band 2C. The spectrum was normalised with respect to its maximum, and is unit-less. A spline is fitted through the chosen continuum points on the spectrum. This spline is then divided by the model spectrum to find the correction factors. The result from multiplying the uncalibrated spectrum by these factors (indicated by the arrow) is shown in orange, and matches the model.
Current usage metrics show cumulative count of Article Views (full-text article views including HTML views, PDF and ePub downloads, according to the available data) and Abstracts Views on Vision4Press platform.
Data correspond to usage on the plateform after 2015. The current usage metrics is available 48-96 hours after online publication and is updated daily on week days.
Initial download of the metrics may take a while.