Fig. 14
Download original image
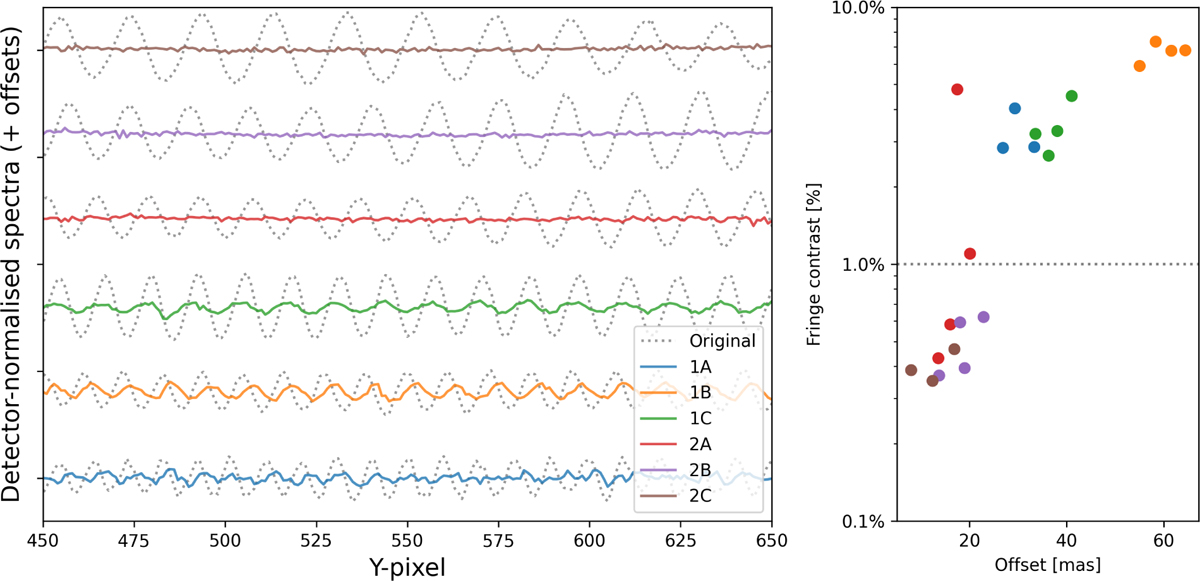
Fringe residuals on the detector of the G dwarf data after applying the PSFF correction for the different sub-bands of channel 1 and 2 shown as the profile (left) and the fringe contrast (right). The offset in the right panel is measured compared to the location of the A star. The larger this offset, the larger the fringe residual.
Current usage metrics show cumulative count of Article Views (full-text article views including HTML views, PDF and ePub downloads, according to the available data) and Abstracts Views on Vision4Press platform.
Data correspond to usage on the plateform after 2015. The current usage metrics is available 48-96 hours after online publication and is updated daily on week days.
Initial download of the metrics may take a while.