Fig. 1
Download original image
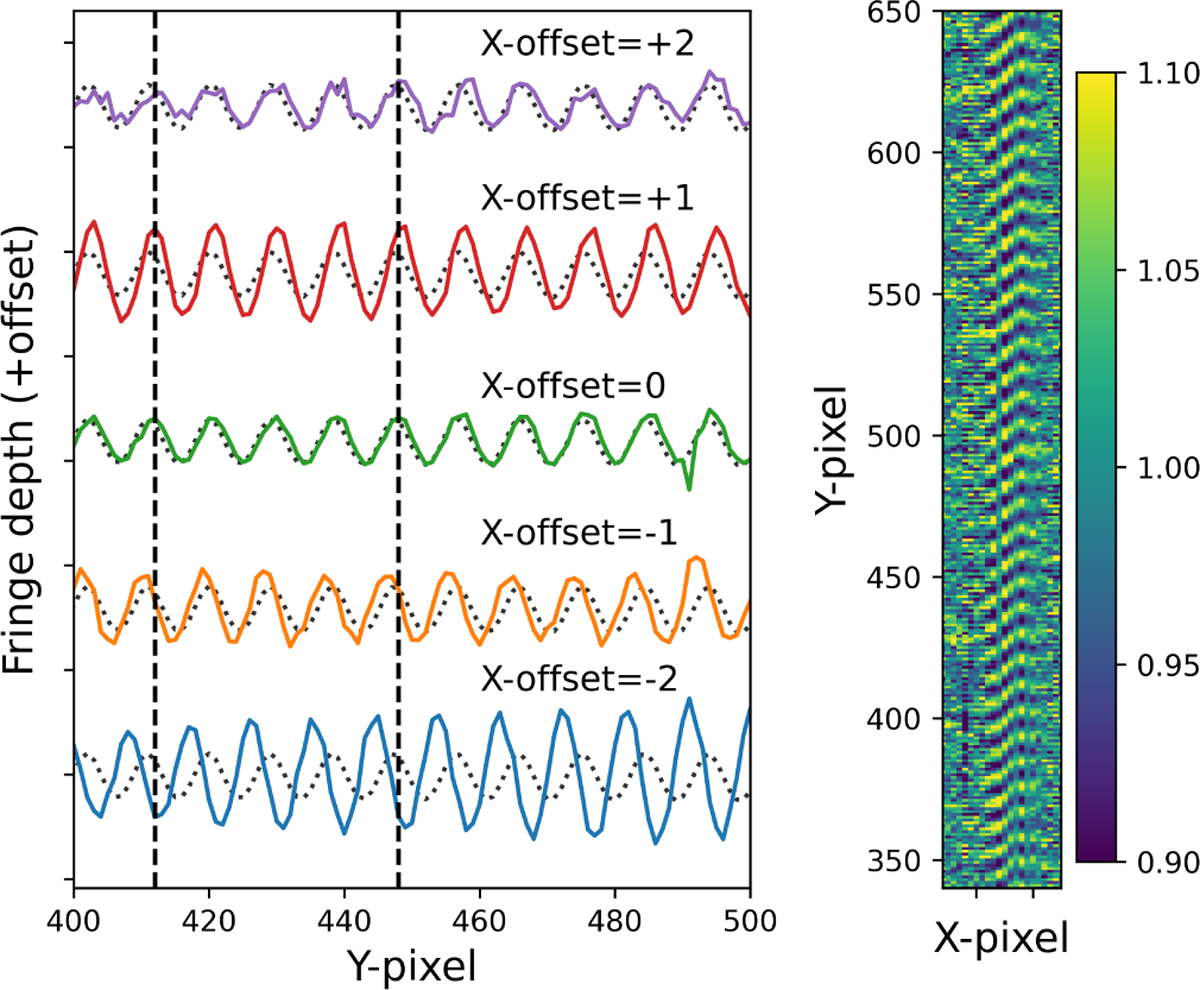
Change in fringe pattern with X-pixel offset from PSF peak (left), and selected area (X-pixel range of 314–335, Y-pixel range of 340–650) of the PSFF fringe flat detector image (right). The data in the left panel are offset (with respect to each other) in the y-direction by 0.4, and the black vertical lines are the location of two fringe peaks at X-offset=1. The extended fringe flat is plotted as a grey dotted line. The change in phase is visible in both the left and right panels, while the change in depth is most visible on the left. The MRS’s IFU uses an image slicer to separate the different parts of the field of view. In this figure, only a single slice is shown.
Current usage metrics show cumulative count of Article Views (full-text article views including HTML views, PDF and ePub downloads, according to the available data) and Abstracts Views on Vision4Press platform.
Data correspond to usage on the plateform after 2015. The current usage metrics is available 48-96 hours after online publication and is updated daily on week days.
Initial download of the metrics may take a while.