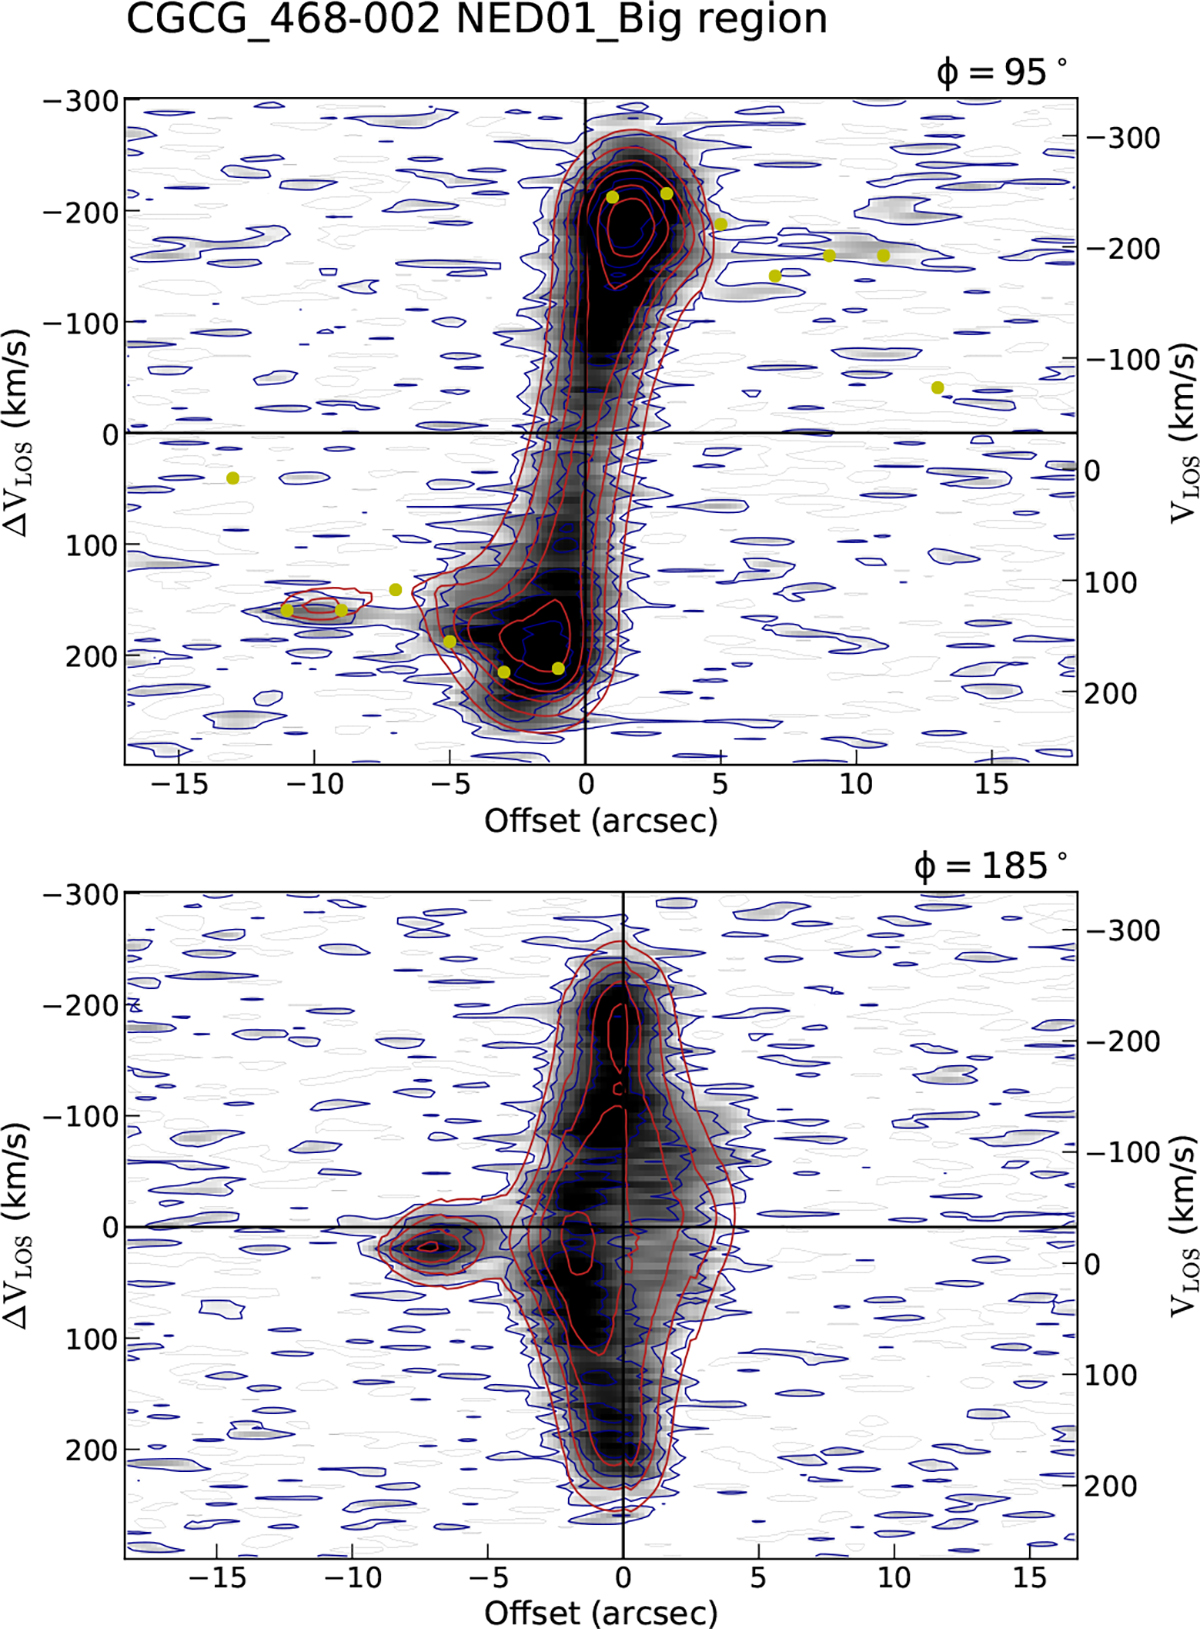
Fig. 7.
Download original image
Position velocity diagrams showing the comparison between the data and the BBarolo best-fit model performed on the Big region around NED01. The red contours show the disk model, and they are overplotted onto the observed ALMA CO(1–0) line data (displayed in grey, with blue contours at 3, 6, 9, 15, 20, 30, 40, and 50σ). The upper panel shows the PV diagram extracted along the major axis. The yellow data points indicate the best-fit rotational velocity of each ring. The lower panel shows the PV diagram computed along the minor axis.
Current usage metrics show cumulative count of Article Views (full-text article views including HTML views, PDF and ePub downloads, according to the available data) and Abstracts Views on Vision4Press platform.
Data correspond to usage on the plateform after 2015. The current usage metrics is available 48-96 hours after online publication and is updated daily on week days.
Initial download of the metrics may take a while.