Fig. 6.
Download original image
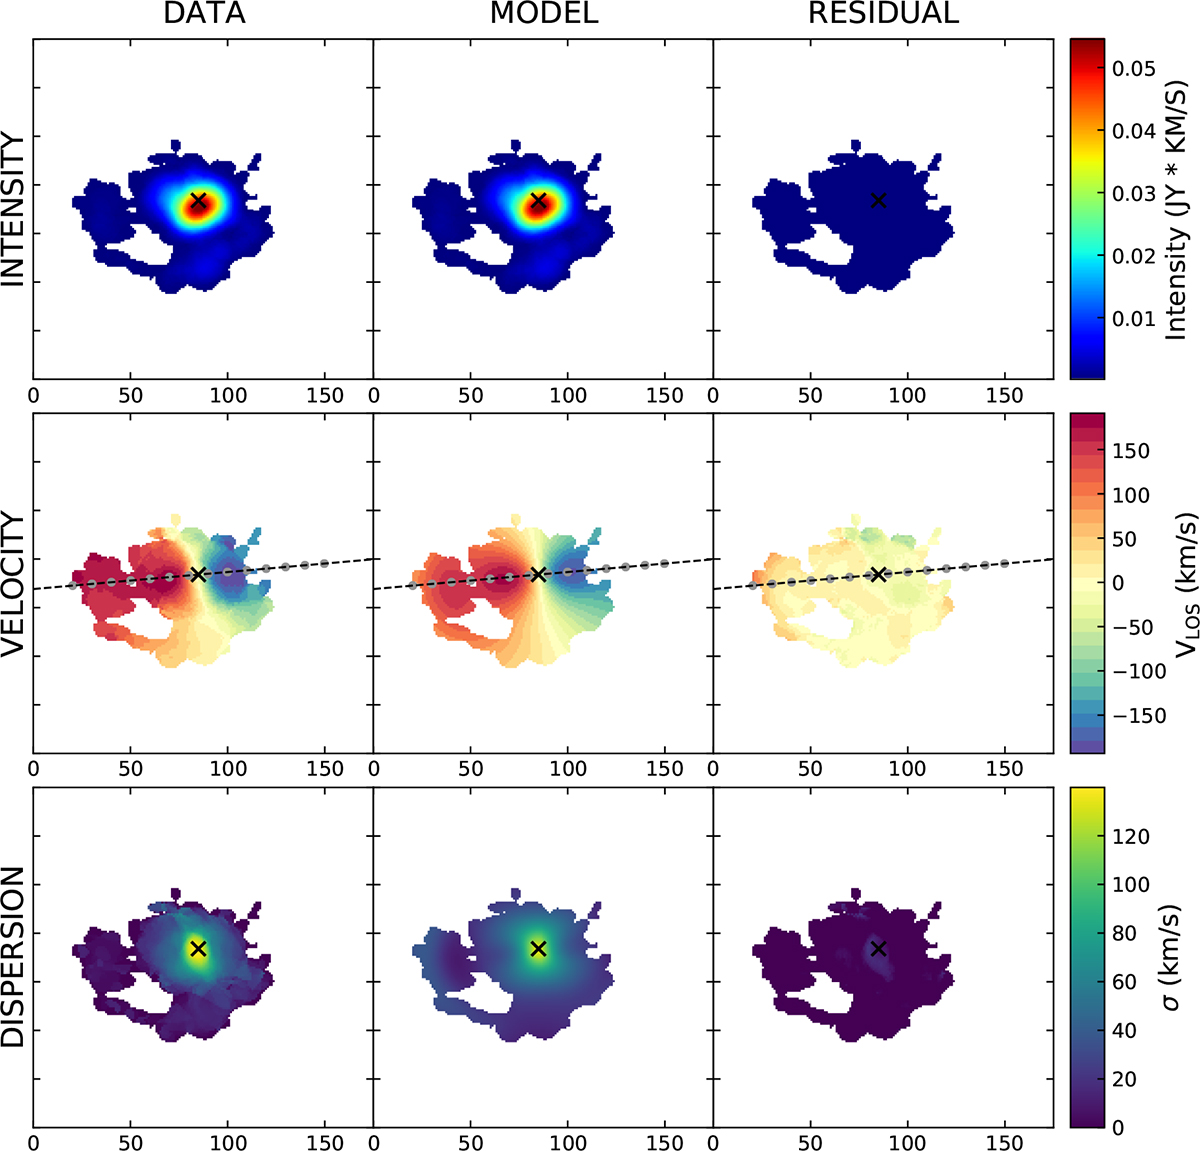
Moment maps showing the comparison between the data and the BBarolo best fit performed on the Big region around NED01. Shown (from left to right) are data, BBarolo model, and residual emission. The rows show (rom top to bottom) the moment 0 map (intensity), moment 1 map (line of sight velocity), and moment 2 map (velocity dispersion). The black cross indicates the rotating disk centre found by the fit, and the dashed black line shows the major axis of the disk model.
Current usage metrics show cumulative count of Article Views (full-text article views including HTML views, PDF and ePub downloads, according to the available data) and Abstracts Views on Vision4Press platform.
Data correspond to usage on the plateform after 2015. The current usage metrics is available 48-96 hours after online publication and is updated daily on week days.
Initial download of the metrics may take a while.