Fig. 3.
Download original image
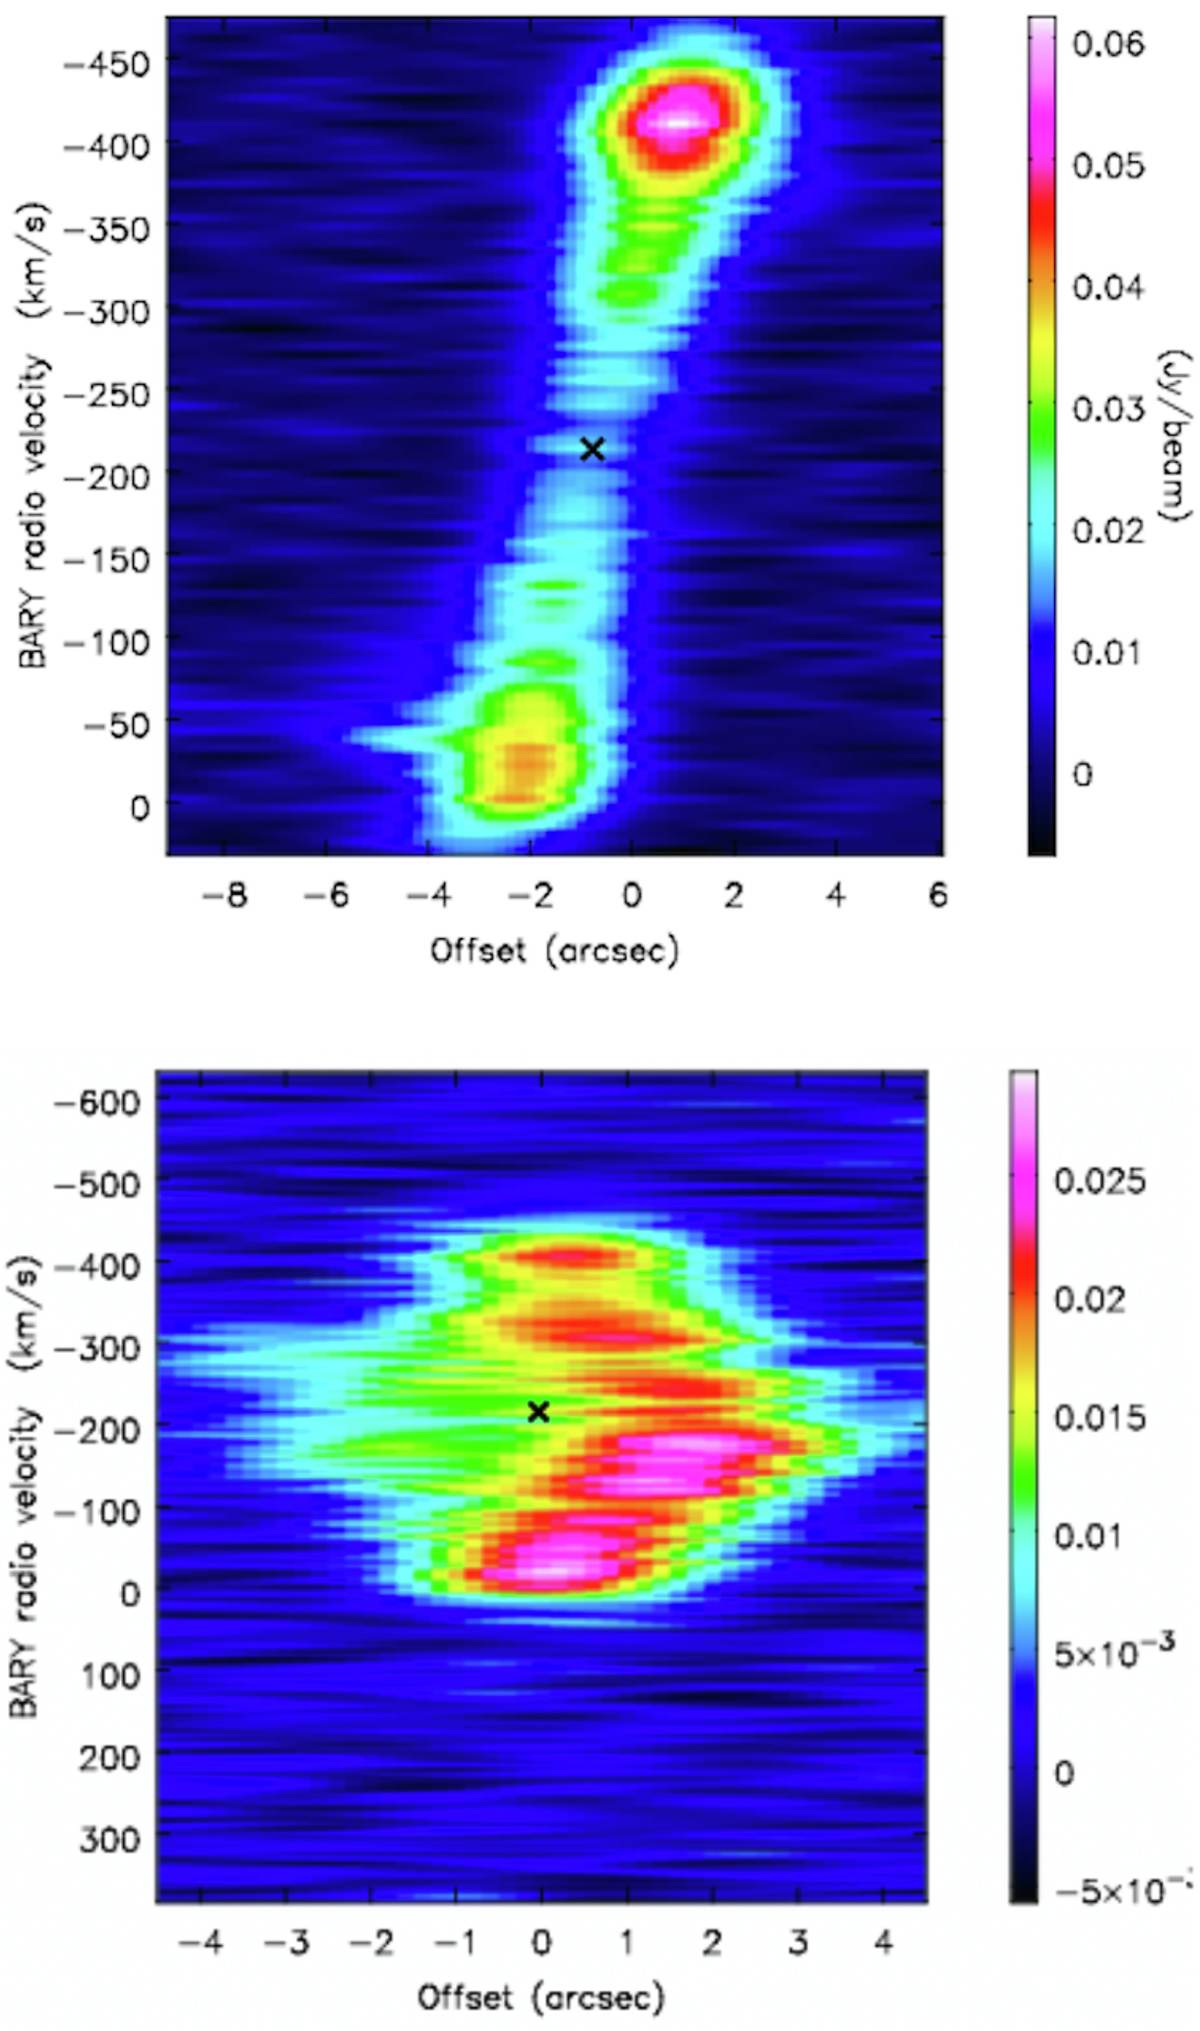
CO(1–0) PV diagrams of NED01, extracted from a datacube where velocities are calculated with respect to the previously known redshift of the source (z = 0.0184). The PV diagrams confirm that our new redshift estimate of z = 0.0178 ± 0.0004, indicated with a black cross, closely matches the kinematic centre of the CO(1–0) source. The upper panel shows the PV diagram obtained from a slit-like aperture along the axis connecting the blue and red peaks of the CO(1–0) emission, with a size of ∼30″ and a position angle of 95° (measured anti-clockwise from the north direction). The PV diagram shown in the bottom panel was computed from a slit-like aperture with a size of ∼9″ orthogonal to the previous one.
Current usage metrics show cumulative count of Article Views (full-text article views including HTML views, PDF and ePub downloads, according to the available data) and Abstracts Views on Vision4Press platform.
Data correspond to usage on the plateform after 2015. The current usage metrics is available 48-96 hours after online publication and is updated daily on week days.
Initial download of the metrics may take a while.