Open Access
Fig. A.1.
Download original image
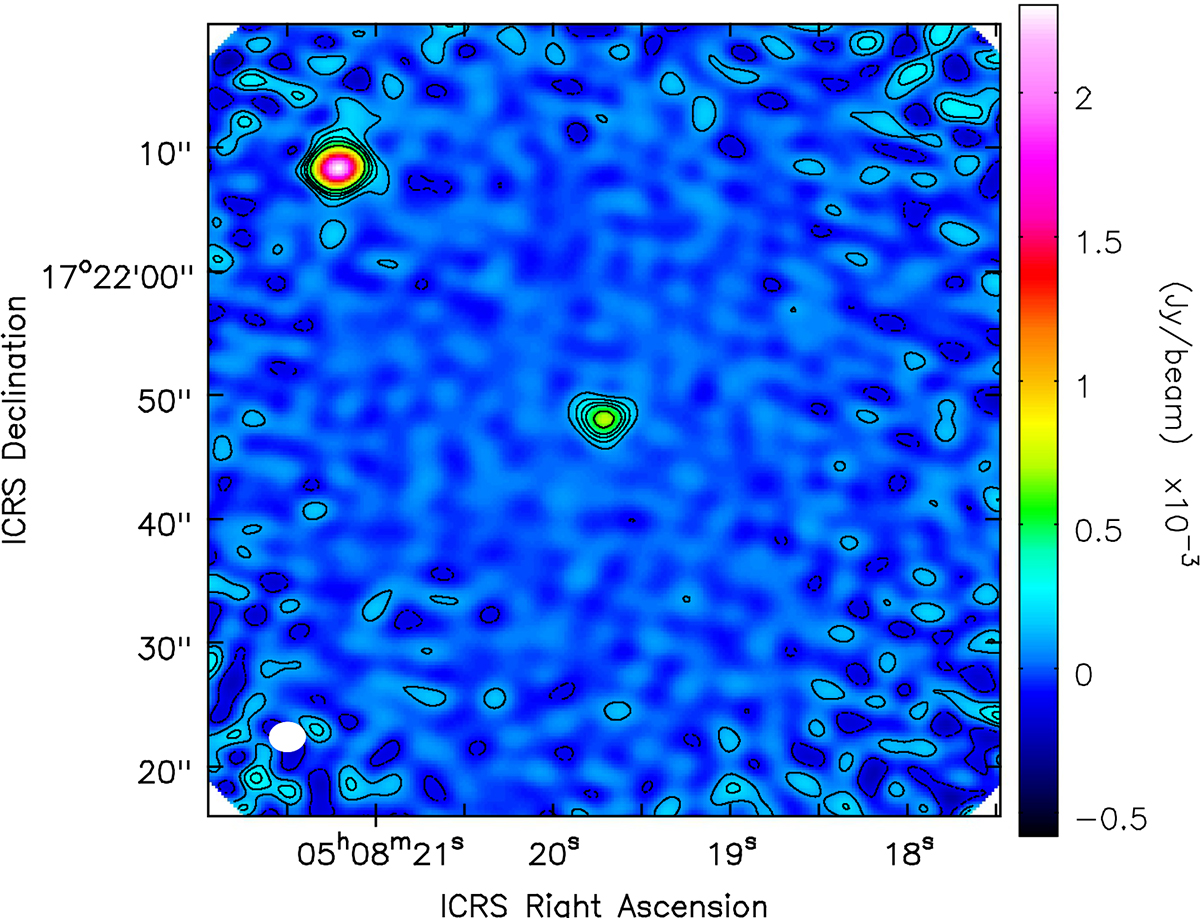
ALMA 3 mm continuum map computed at an average frequency of 100 GHz. The map was obtained by averaging the data over a bandwidth of 4 GHz. Contours are plotted at (− 3, 3, 6, 9, 12, 18)×σcont, with σcont = 0.03 mJy/beam being the average 1σ rms noise level within the central 10″ portion of the FoV.
Current usage metrics show cumulative count of Article Views (full-text article views including HTML views, PDF and ePub downloads, according to the available data) and Abstracts Views on Vision4Press platform.
Data correspond to usage on the plateform after 2015. The current usage metrics is available 48-96 hours after online publication and is updated daily on week days.
Initial download of the metrics may take a while.