Fig. 17.
Download original image
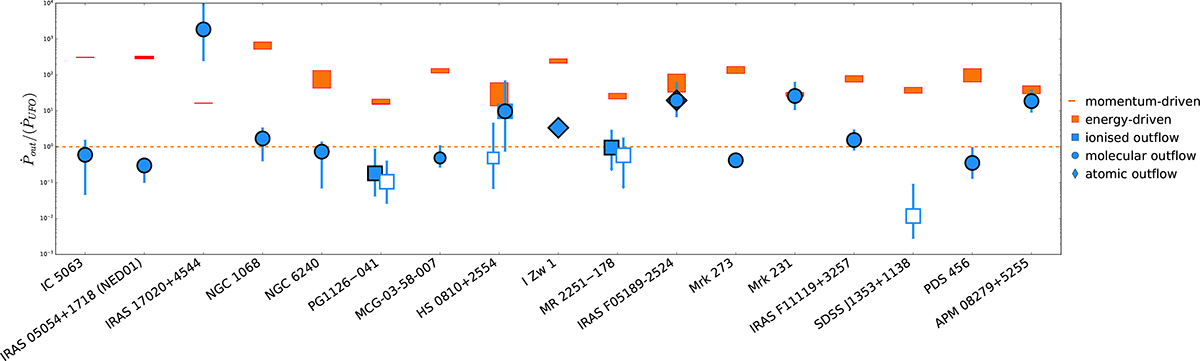
Ratio of the large-scale outflow rate to the UFO momentum rate (adapted from Marasco et al. 2020; Tozzi et al. 2021). Different shapes identify different gas phases of the winds. The theoretical prediction for momentum-driven (Ṗout/ṖUFO = 1) and energy-driven winds are shown by a dashed line and orange rectangles, respectively. Empty and filled squares indicate Hα and [OIII]-based measurements. Values reported in this plot are taken from this work, Bischetti et al. (2019), Braito et al. (2018), Chartas et al. (2009), Cicone et al. (2014), Feruglio et al. (2015, 2017), García-Burillo et al. (2014), González-Alfonso et al. (2017), Longinotti et al. (2015, 2018), Lutz et al. (2020), Marasco et al. (2020), Mizumoto et al. (2019), Reeves & Braito (2019), Rupke et al. (2017), Sirressi et al. (2019), Smith et al. (2019), Tombesi et al. (2015), Tozzi et al. (2021), Veilleux et al. (2017).
Current usage metrics show cumulative count of Article Views (full-text article views including HTML views, PDF and ePub downloads, according to the available data) and Abstracts Views on Vision4Press platform.
Data correspond to usage on the plateform after 2015. The current usage metrics is available 48-96 hours after online publication and is updated daily on week days.
Initial download of the metrics may take a while.