Fig. 16.
Download original image
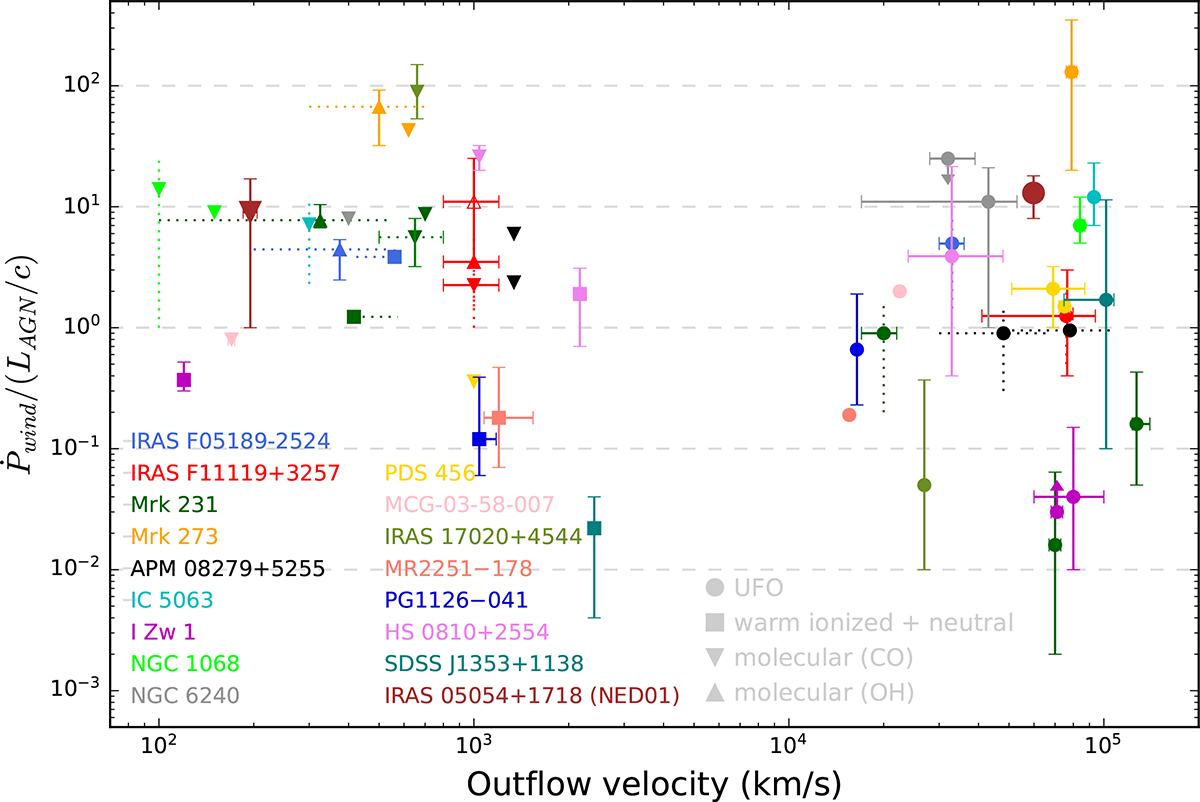
Outflow momentum rate plotted against its velocity for twelve objects with both ultra-fast winds and large-scale galactic outflows, adapted from Smith et al. (2019). Different colors and shapes identify different objects and outflows. Solid error bars are used for values with upper and lower errors calculated, dotted bars if only a range of value was available, and arrows for limits. Values reported in this plot taken from this work, Bischetti et al. (2019), Chartas et al. (2020), Cicone et al. (2014), Feruglio et al. (2015, 2017), Fluetsch et al. (2019), García-Burillo et al. (2014), González-Alfonso et al. (2017), Luminari et al. (2018), Longinotti et al. (2018), Marasco et al. (2020), Mizumoto et al. (2019), Longinotti et al. (2015), Rupke et al. (2017), Sirressi et al. (2019), Smith et al. (2019), Tombesi et al. (2015, 2017), Tozzi et al. (2021), Veilleux et al. (2017).
Current usage metrics show cumulative count of Article Views (full-text article views including HTML views, PDF and ePub downloads, according to the available data) and Abstracts Views on Vision4Press platform.
Data correspond to usage on the plateform after 2015. The current usage metrics is available 48-96 hours after online publication and is updated daily on week days.
Initial download of the metrics may take a while.