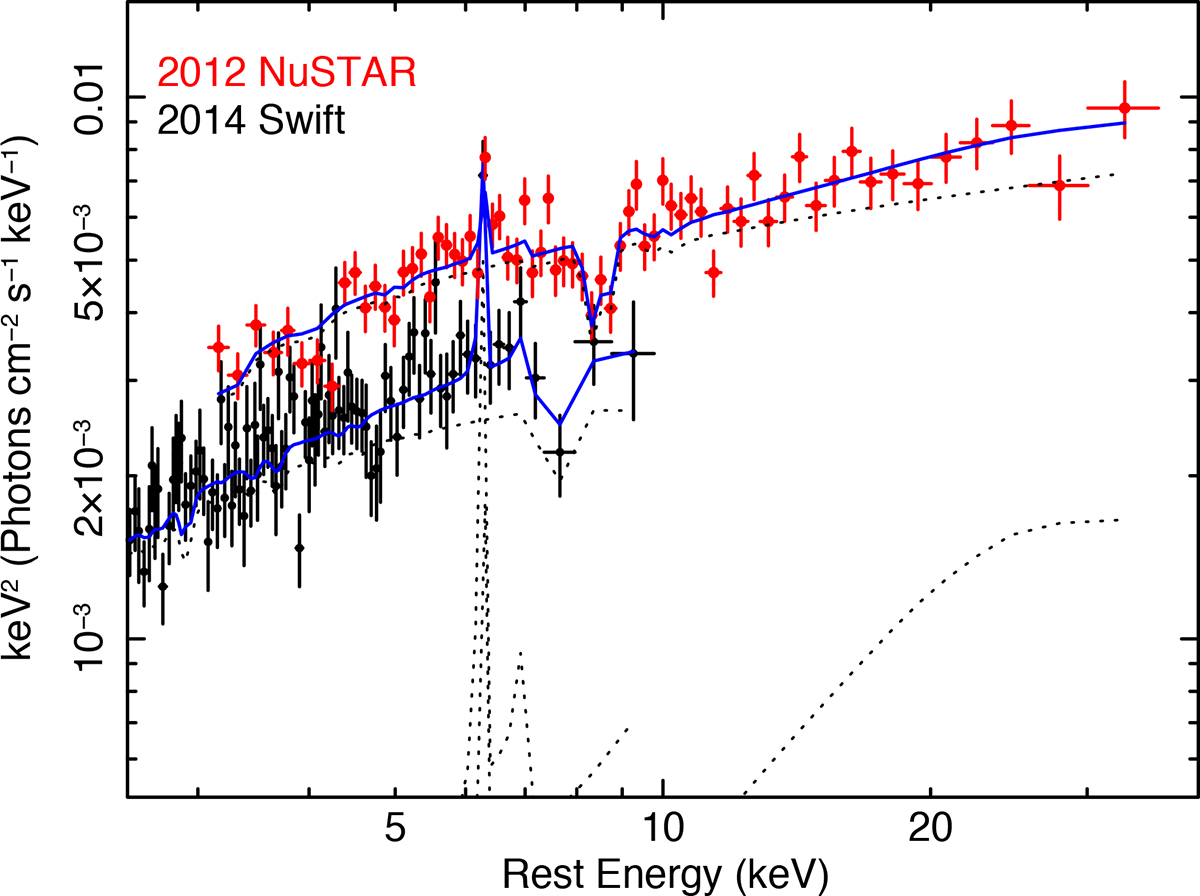
Fig. 14.
Download original image
Spectra and best-fit model (blue line) for the Swift (black data points) and 2012 NuSTAR (red) observations. The continuum model includes an absorbed power-law component and a reflected component (grey dotted lines). The reflected component (modelled with XILLVER) also includes the expected Fe Kα emission line at 6.4 keV. The NH of the neutral absorber, and the normalisation of the primary power law and of the reflected components are all allowed to vary. The model also includes an ionised outflowing absorber, for which the same ionisation is assumed, but the column densities and velocity are allowed to differ in the two spectra. The Swift data were rebinned for plotting purposes.
Current usage metrics show cumulative count of Article Views (full-text article views including HTML views, PDF and ePub downloads, according to the available data) and Abstracts Views on Vision4Press platform.
Data correspond to usage on the plateform after 2015. The current usage metrics is available 48-96 hours after online publication and is updated daily on week days.
Initial download of the metrics may take a while.