Fig. 13.
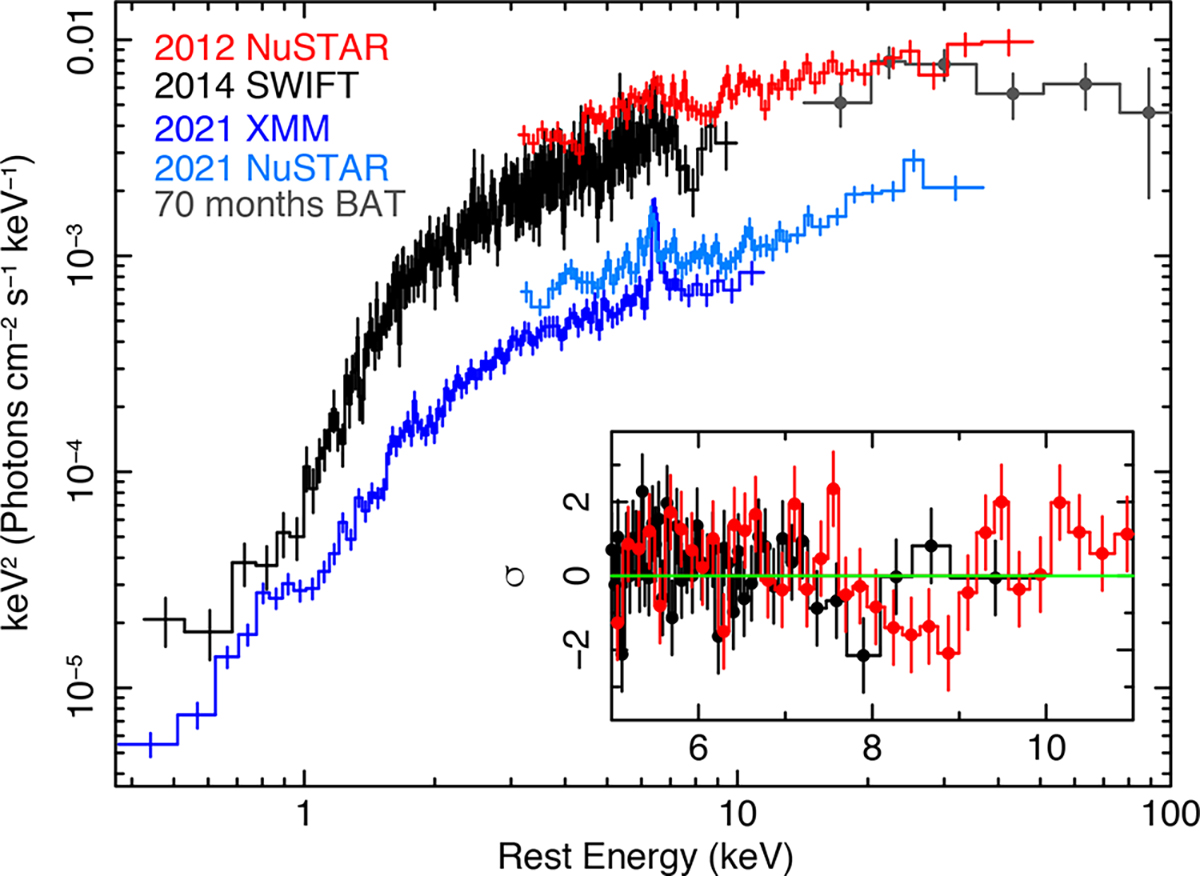
Download original image
Broad-band (rest frame 0.3–60 keV) X-ray spectra of all the observations of IRAS 05054+1718. The EFE spectra are obtained unfolding the data against a simple power-law model with Γ = 2. The 2012 NuSTAR observation is shown in red, the 2014 Swift is in black, while the spectra obtained with the coordinated XMM-Newton and NuSTAR observations are shown in dark and light blue, respectively. We also included the averaged Swift-BAT spectrum from the 70-month survey (Baumgartner et al. 2013). The residuals obtained from the joint fit for the Swift and NuSTAR spectra using a typical model for a moderately obscured Seyfert 2 as NED01 are shown in the inset. The model, composed of an absorbed primary power-law component, a scattered component, with the same photon index (Γ), and a reflected component, is able to reproduce the broad-band emission, but it leaves some residuals in absorption (see Sect. 7.1).
Current usage metrics show cumulative count of Article Views (full-text article views including HTML views, PDF and ePub downloads, according to the available data) and Abstracts Views on Vision4Press platform.
Data correspond to usage on the plateform after 2015. The current usage metrics is available 48-96 hours after online publication and is updated daily on week days.
Initial download of the metrics may take a while.