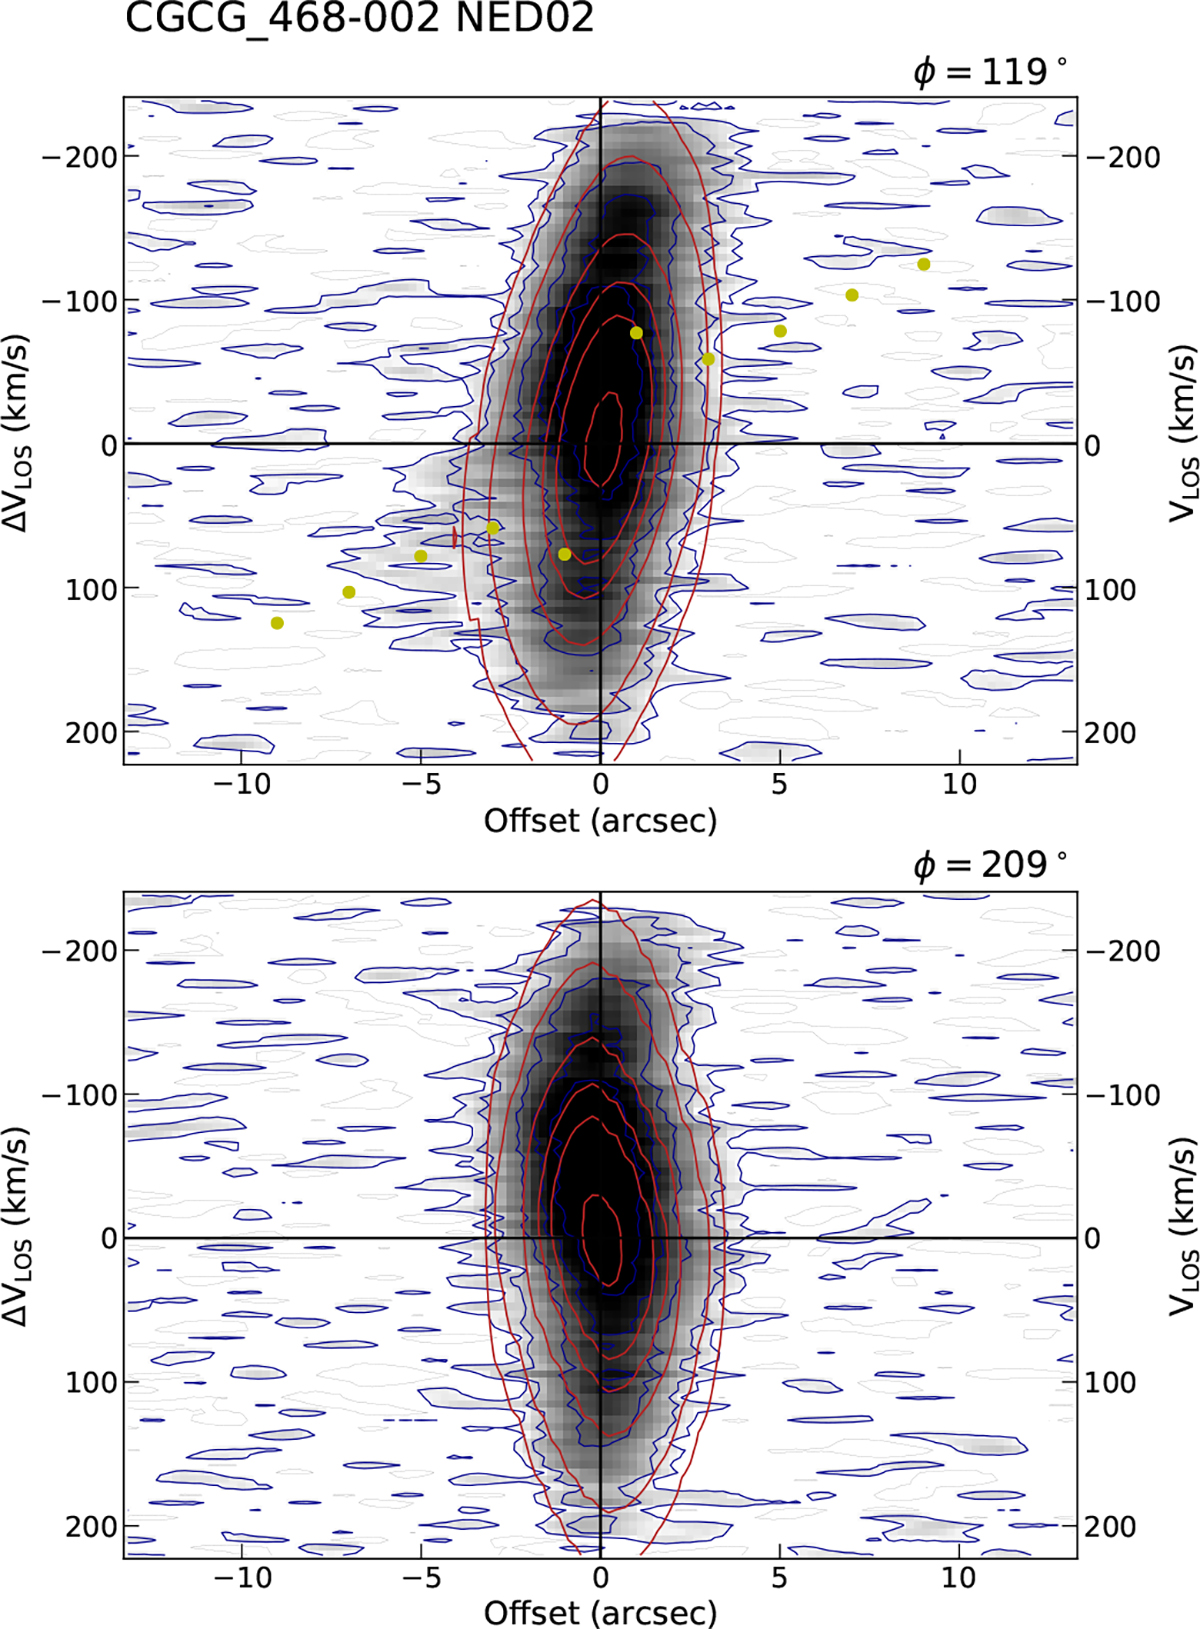
Fig. 11.
Download original image
Position velocity diagrams of NED02 showing the comparison between the data (blue contours, plotted at 3, 6, 9, 15, 20, 30, 40, and 50σ) and the BBarolo best-fit rotating disk model (red contours). The upper panel shows the PV diagram extracted along the major axis, and the lower panel shows the one extracted along the minor axis of rotation.
Current usage metrics show cumulative count of Article Views (full-text article views including HTML views, PDF and ePub downloads, according to the available data) and Abstracts Views on Vision4Press platform.
Data correspond to usage on the plateform after 2015. The current usage metrics is available 48-96 hours after online publication and is updated daily on week days.
Initial download of the metrics may take a while.