Fig. 3.
Download original image
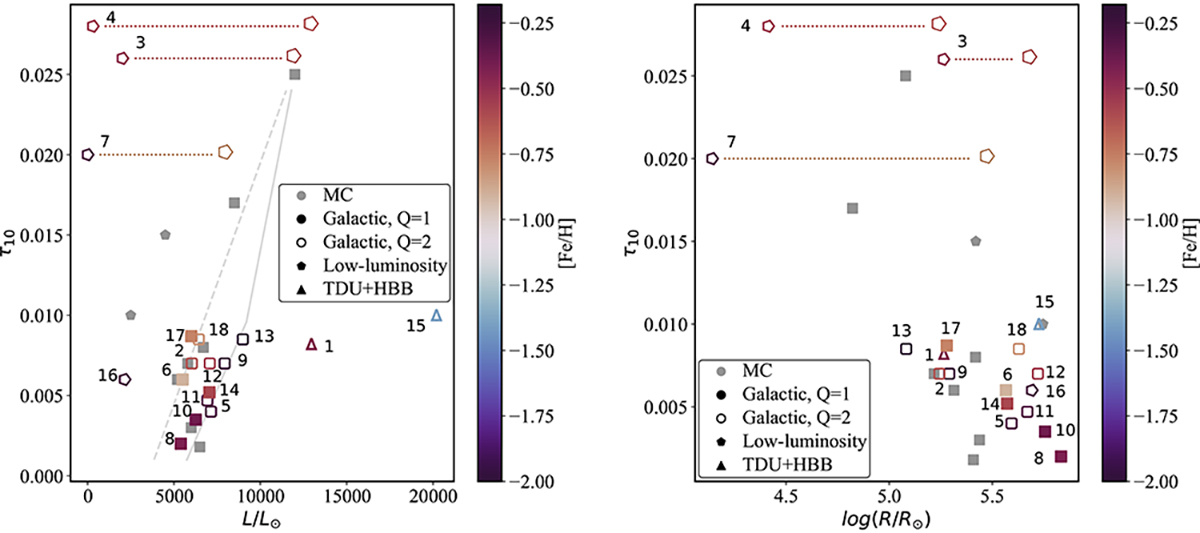
Optical depths at 10 μm as a function of the luminosity of the star (left panel) and of the distance of the inner border of the dusty zone from the centre of the star (right panel). The physical and dust parameters are derived from SED fitting (see Sect. 3). The vertical colour bar indicates the relative metallicity of the sources. The Galactic post-AGB stars flagged as Q1 are reported with filled symbols, while those flagged as Q2 are reported with empty symbols. The grey markers refer to the LMC stars studied by T22. The dotted lines show the projection of the stars obtained by changing the distance retrieved from Bailer-Jones et al. (2021) and therefore the brightness. Table 1 reports the uncertainties in luminosity. In the left panel, the dashed grey line represents the trend in the τ − L plane for the metal-poor stars of the Galaxy and the MC, and the solid grey line represents the trend in the τ − L plane for the metal-rich objects of the same sample.
Current usage metrics show cumulative count of Article Views (full-text article views including HTML views, PDF and ePub downloads, according to the available data) and Abstracts Views on Vision4Press platform.
Data correspond to usage on the plateform after 2015. The current usage metrics is available 48-96 hours after online publication and is updated daily on week days.
Initial download of the metrics may take a while.