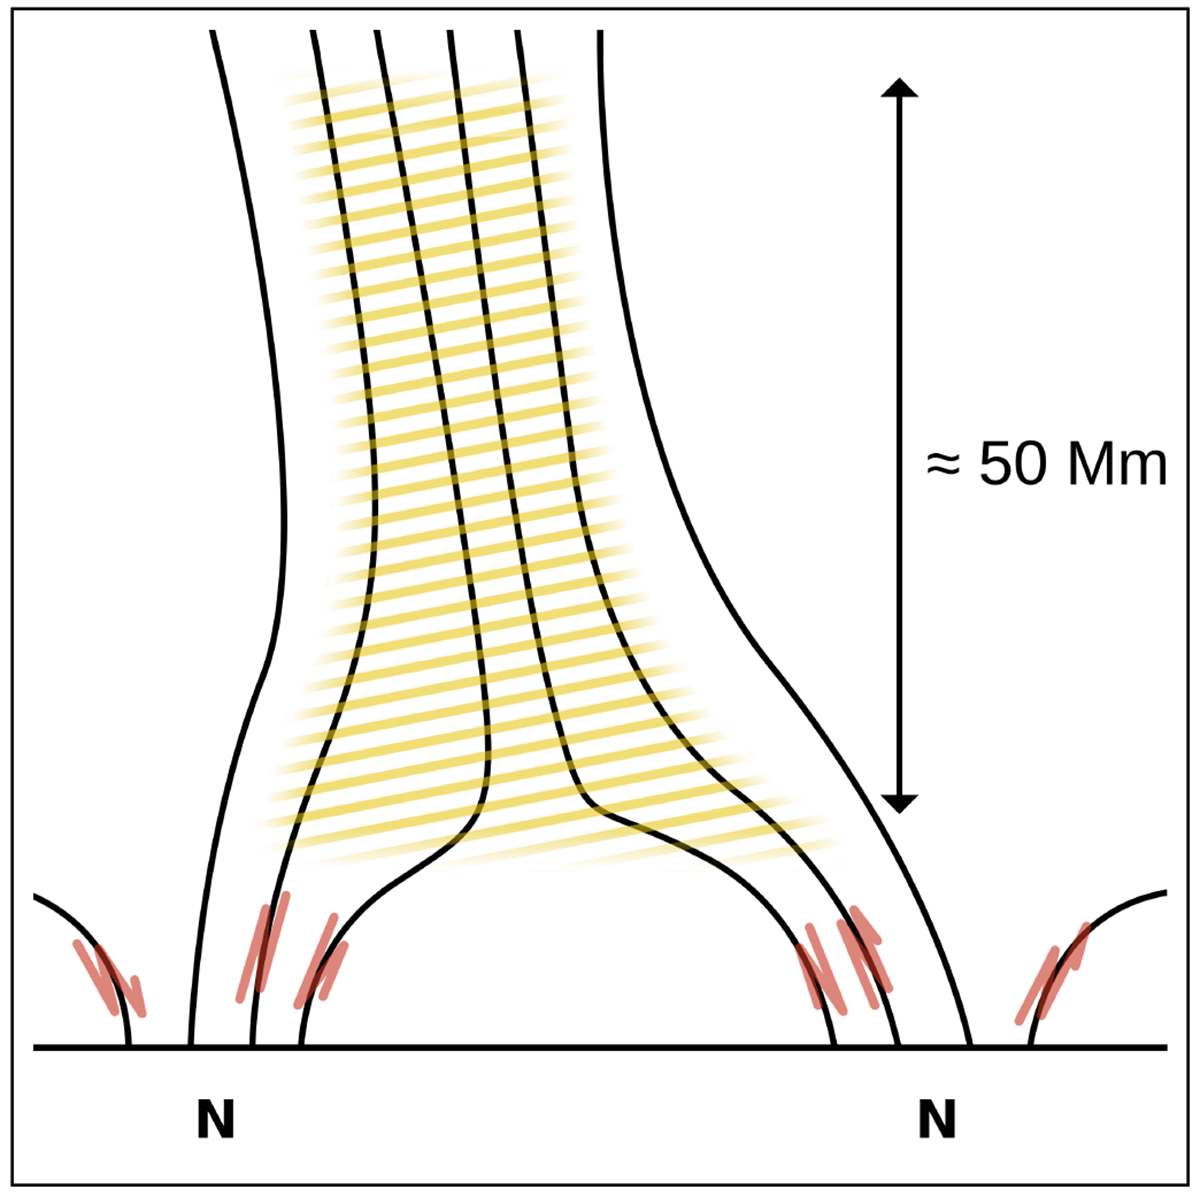
Fig. 7.
Download original image
Relation of the diffuse emission to the magnetic field configuration. We illustrate the vertical cross section of the observed system along the direction that connects the two positive magnetic field concentrations from Fig. 4a. The magnetic field patches are marked with N for the northern polarity, and the spicular emission they host is shown in orange. The magnetic field lines form a canopy below the source region of the diffuse emission. The diffuse emission is shown in yellow. See Sect. 4.1.
Current usage metrics show cumulative count of Article Views (full-text article views including HTML views, PDF and ePub downloads, according to the available data) and Abstracts Views on Vision4Press platform.
Data correspond to usage on the plateform after 2015. The current usage metrics is available 48-96 hours after online publication and is updated daily on week days.
Initial download of the metrics may take a while.