Fig. 5.
Download original image
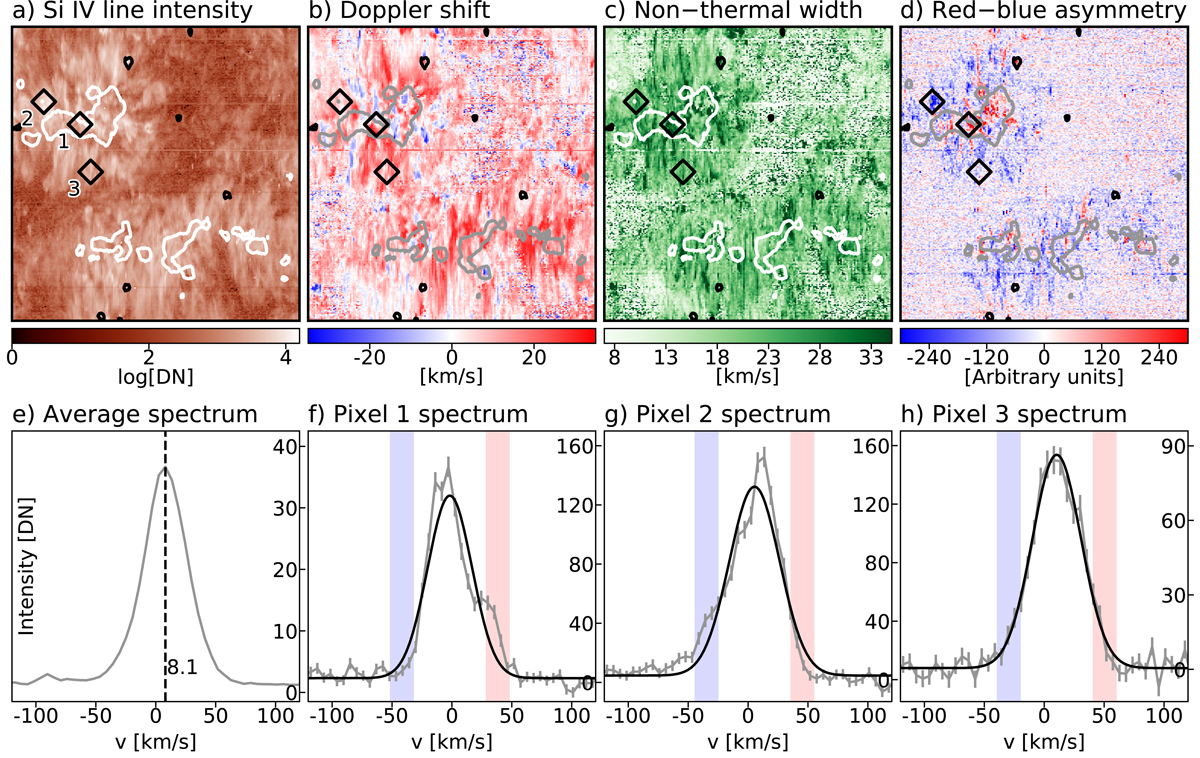
Properties of the Si IV 1394 Å line profiles in the vicinity of the diffuse region. The panels show (a) the total line intensity, (b) the Doppler shift, (c) the nonthermal width, (d) the red-blue asymmetry, and (e) the average profile of the whole area shown in the other panels. The average Doppler shift of 8.1 km s−1 is indicated. Panels f–h show the profiles at three individual spatial pixels. The respective locations of these profiles are marked with diamonds in the top panels. The gray bars in the profiles indicate the errors, and black lines represent single Gaussians fitted to the profiles. The contours in the top panels have the same meaning as in Fig. 2. The wavelength is given in Doppler-shift units (positive is red) in the bottom panels. In panels f–h the integration ranges used to calculate the red-blue asymmetry for the respective pixel are shaded. See Sect. 3.4.
Current usage metrics show cumulative count of Article Views (full-text article views including HTML views, PDF and ePub downloads, according to the available data) and Abstracts Views on Vision4Press platform.
Data correspond to usage on the plateform after 2015. The current usage metrics is available 48-96 hours after online publication and is updated daily on week days.
Initial download of the metrics may take a while.