Fig. 4.
Download original image
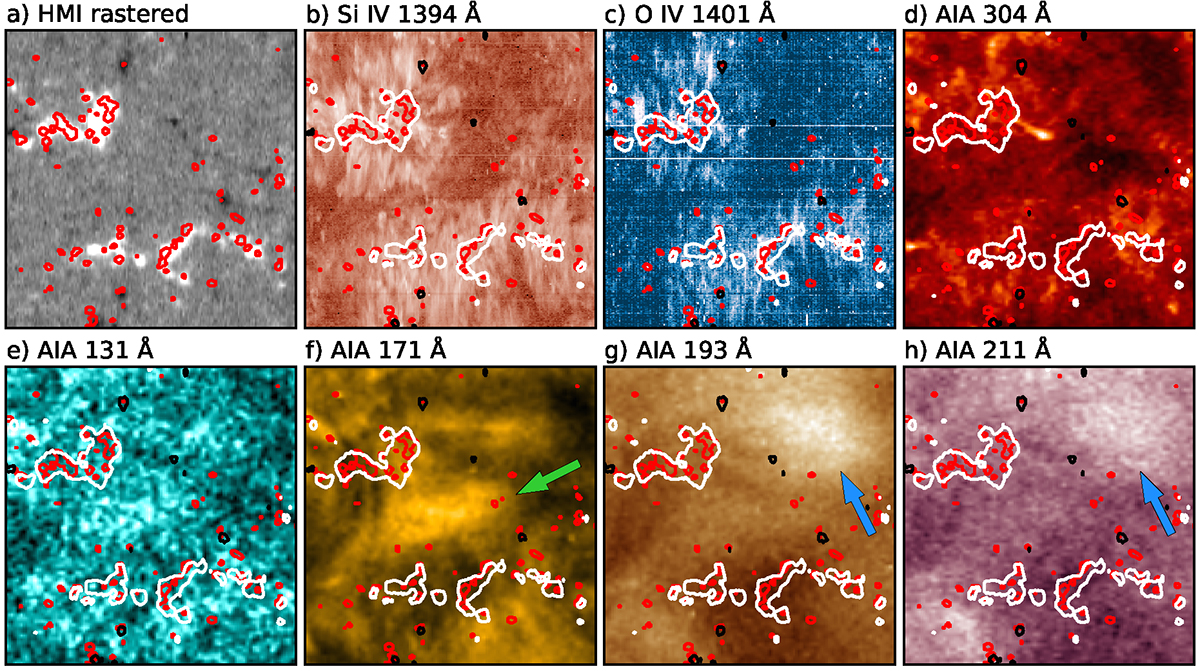
Zoom into the diffuse region in different spectral bands. The individual panels represent (a) the rastered line-of-sight magnetogram from HMI, as in Figs. 2b and c, (b) the Si IV 1394 Å emission line intensity from IRIS, as in Figs. 2a and c, (c) the O IV 1401 Å emission line intensity from IRIS, and (d)–(h) observations from AIA in different channels indicated in each panel. Panels b and c are plotted in logarithmic scale. Like in Fig. 2, black and white contours outline the magnetic field at values of −30 G and +30 G, respectively. The red contours outline the brightenings in the Si I Lyman continuum. The green arrow in panel f points to the diffuse region we studied. The blue arrows in panels g and h point to a region with hotter plasma. See Sect. 3.3.
Current usage metrics show cumulative count of Article Views (full-text article views including HTML views, PDF and ePub downloads, according to the available data) and Abstracts Views on Vision4Press platform.
Data correspond to usage on the plateform after 2015. The current usage metrics is available 48-96 hours after online publication and is updated daily on week days.
Initial download of the metrics may take a while.