Fig. 3.
Download original image
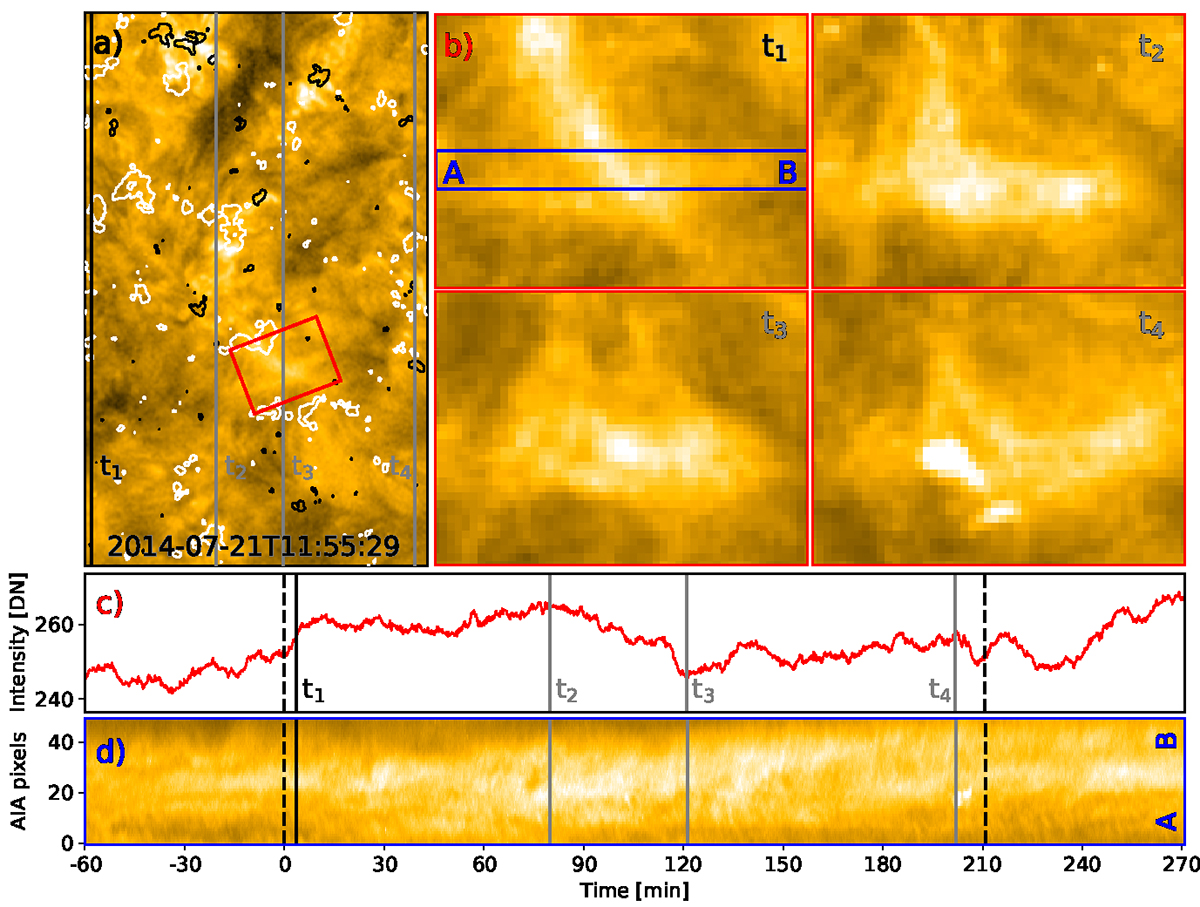
Evolution of the diffuse coronal region. Panel a shows a repetition of Fig. 2b displaying the AIA 171 Å image at time t1, with black and white contours indicating opposite magnetic patches in the photosphere. The red rectangle highlights the location of the diffuse coronal region. Panel b shows four snapshots in this rectangle at times t1 to t4, as indicated in panels c and d, (plotted in linear scaling). Panel c shows the variability of the emission averaged within the red rectangle, which does not exceed about 10% over more than five hours. Panel d displays the emission along the slit from A to B, as indicated in panel b. The intensity here is integrated (vertically) between the blue lines. The time axis in panels c and d is set to zero when the IRIS raster starts. The IRIS raster ends at about 210 min. The temporal evolution is available in an online movie. See Sect. 3.2.
Current usage metrics show cumulative count of Article Views (full-text article views including HTML views, PDF and ePub downloads, according to the available data) and Abstracts Views on Vision4Press platform.
Data correspond to usage on the plateform after 2015. The current usage metrics is available 48-96 hours after online publication and is updated daily on week days.
Initial download of the metrics may take a while.