Fig. 1.
Download original image
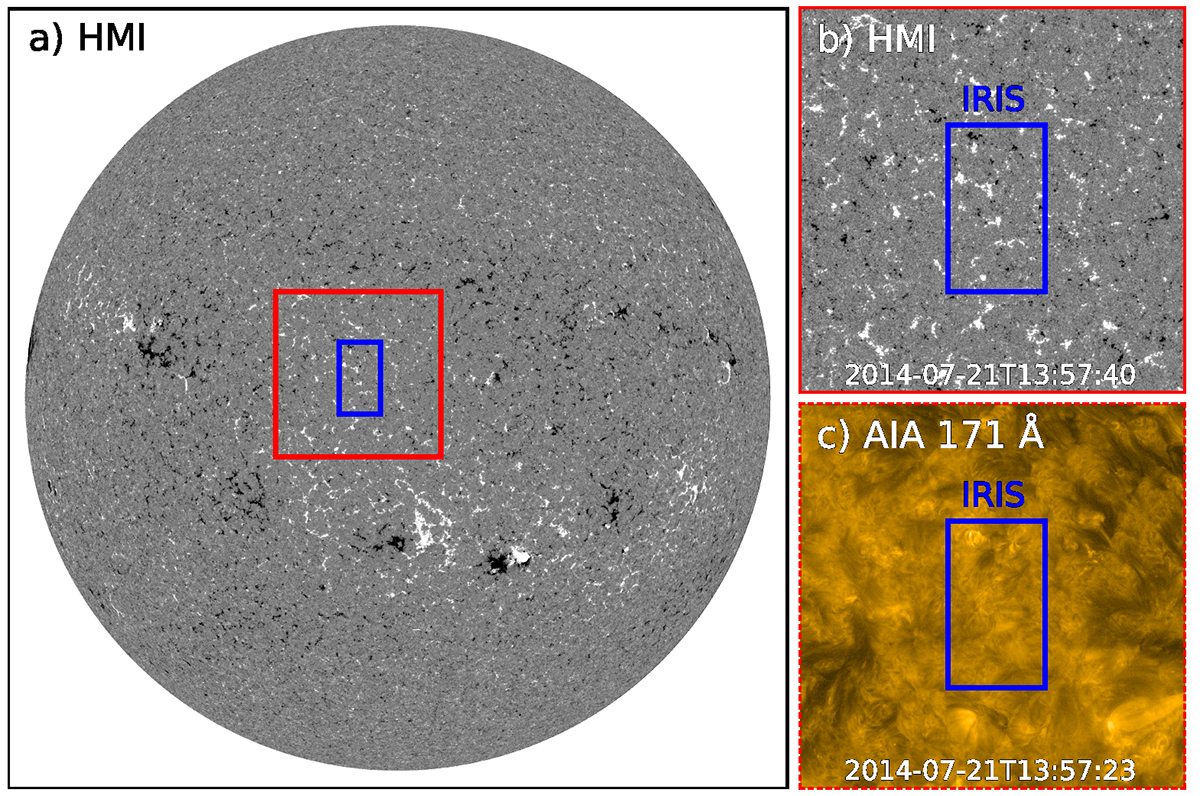
Context of our observations. Panel a shows a full-disk magnetogram from HMI observed around the midpoint of the raster map acquired by IRIS. The IRIS field of view is outlined with a blue box. The field of view indicated by the red box is enlarged in panel b. Panel c shows the same area as observed with the 171 Å channel of AIA, plotted in logarithmic scaling. Time stamps that correspond to the beginning of the exposure of HMI and AIA are given with the plots. See Sect. 2.1.
Current usage metrics show cumulative count of Article Views (full-text article views including HTML views, PDF and ePub downloads, according to the available data) and Abstracts Views on Vision4Press platform.
Data correspond to usage on the plateform after 2015. The current usage metrics is available 48-96 hours after online publication and is updated daily on week days.
Initial download of the metrics may take a while.