Fig. 9
Download original image
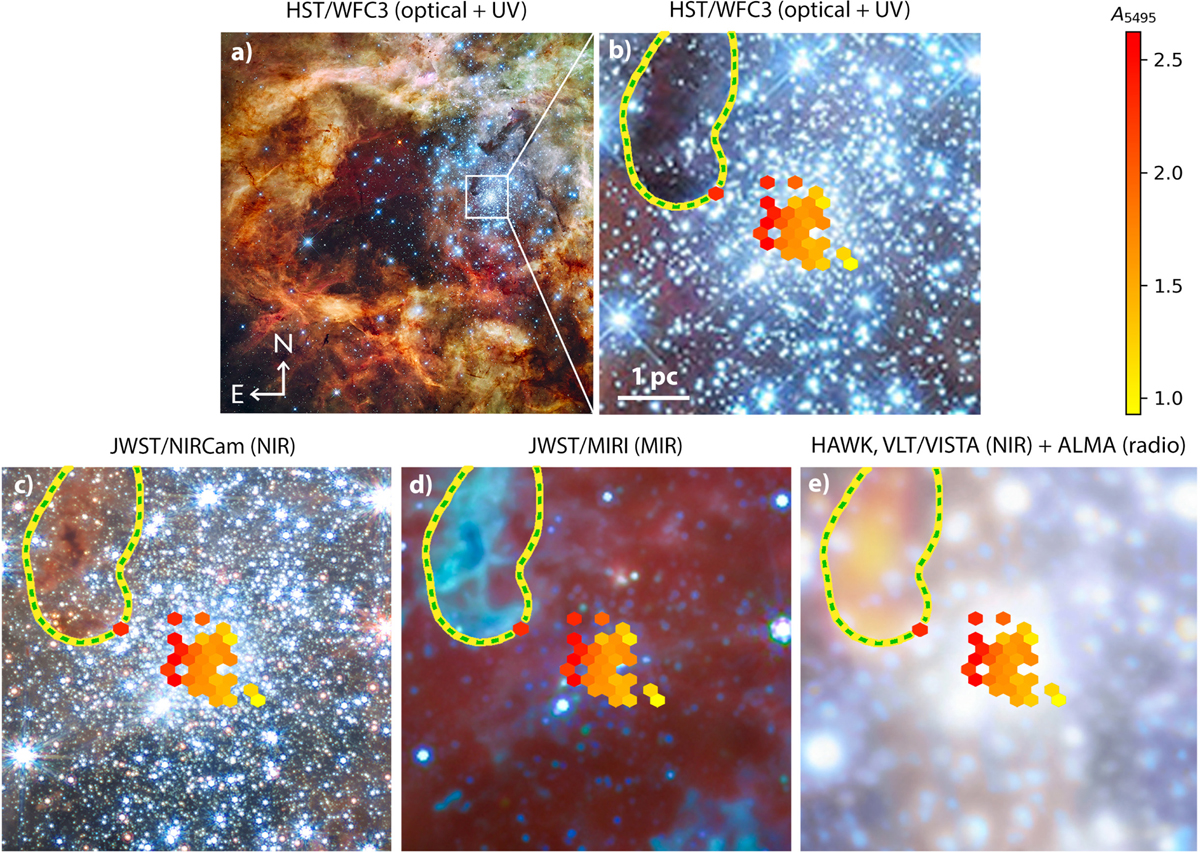
Multi-wavelength view of the cluster R136 and surroundings. Panels a) and b) show the cluster imaged in optical and UV with WFC3/HST. The wider area around R316 is shown on the left, on the right we zoom in on the core of the cluster. The extinction map is projected onto the zoomed image in yellow to red colours (as in Fig. 7). Imaged in optical and UV, the dark cloud north-east of the cluster, an extension of the Stapler Nebula, appears to have a considerable projected distance from the cluster core (≈1–2 pc). The green-yellow dashed line indicates the contour of a 13CO column density of 1015 cm−2 (see Fig. 10). Panels c)–e) are as panel b, but with different background images: a NIR image captured with NIRCam on James Webb Space Telescope (JWST), a mid-infrared (MIR) image captured with MIRI on JWST, and a composite NIR/(sub-)mm image, captured in NIR with HAWK- I/VLT and VISTA, and in (sub-)mm wavelengths with ALMA. In panel c) the orange-brown colours show cold gas corresponding roughly with the dark cloud in the HST image. Moving to longer wavelengths in panel c), the stars fade and the cool gas consisting of hydrocarbons is lighting up (turquoise). In panel e) light pink regions correspond to relatively hot gas (NIR), and red-yellow areas indicate the presence of cold, dense gas (ALMA). It seems possible that the extinction gradient in R136 may be associated with a lower density fringe of the extension of the Stapler Nebula; see also Fig. 10 for additional evidence. Image credits (from left to right): NASA, ESA, F. Paresce (INAF-IASF, Bologna, Italy), R. O’Connell (University of Virginia, Charlottesville), and the Wide Field Camera 3 Science Oversight Committee; NASA, ESA, CSA, and STScI; IMAGE: NASA, ESA, CSA, STScI, Webb ERO Production Team; ESO, ALMA (ESO/NAOJ/NRAO)/Wong et al., 2022 ESO/M.-R. Cioni/VISTA Magellanic Cloud survey, Acknowledgment: Cambridge Astronomical Survey Unit.
Current usage metrics show cumulative count of Article Views (full-text article views including HTML views, PDF and ePub downloads, according to the available data) and Abstracts Views on Vision4Press platform.
Data correspond to usage on the plateform after 2015. The current usage metrics is available 48-96 hours after online publication and is updated daily on week days.
Initial download of the metrics may take a while.