Fig. 7
Download original image
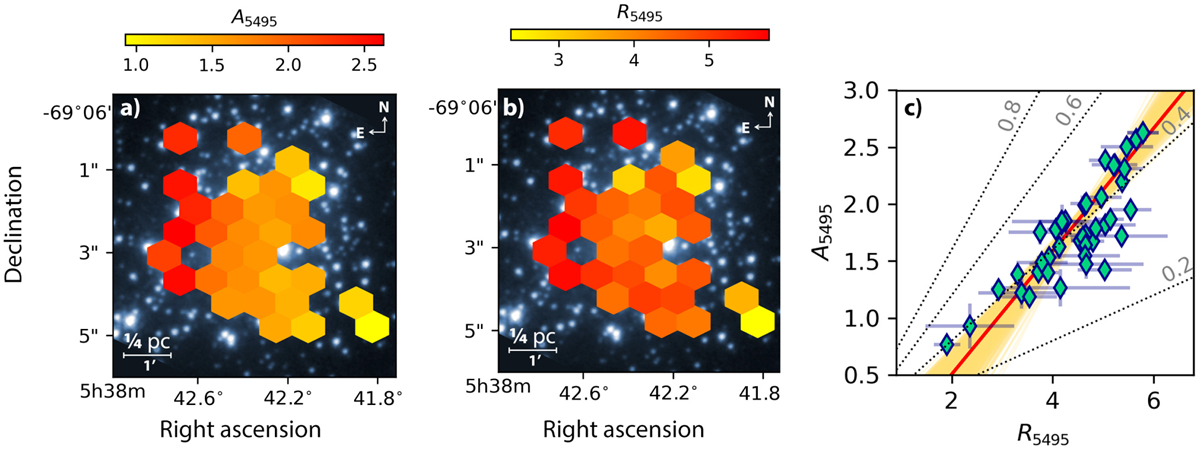
Spatial trends in AV and R5495 in the core of R136. Panels a and b show maps of A5495 and R5495 overplotted on HST/WFC3 V-band (F555W) photometry (O’Connell 2010). The colour of each hexagon corresponds to the average value of the quantity in that region of the core, with red tints corresponding to higher values of A5495 and R5495 and the yellow tints to lower values. A clear spatial trend is visible for A5495, with higher values of A5495 towards the east of the cluster (see also Fig. 8). A similar, albeit weaker trend is visible for R5495. Panel c shows that there is a strong correlation between A5495 and R5495 (colours as in Fig. 5). The dotted lines in the background indicate constant values of A4405 – A5495 ranging from 0.2 to 0.8; the obtained relation implies A4405 – A5495 ≈ 0.4.
Current usage metrics show cumulative count of Article Views (full-text article views including HTML views, PDF and ePub downloads, according to the available data) and Abstracts Views on Vision4Press platform.
Data correspond to usage on the plateform after 2015. The current usage metrics is available 48-96 hours after online publication and is updated daily on week days.
Initial download of the metrics may take a while.