Fig. 6
Download original image
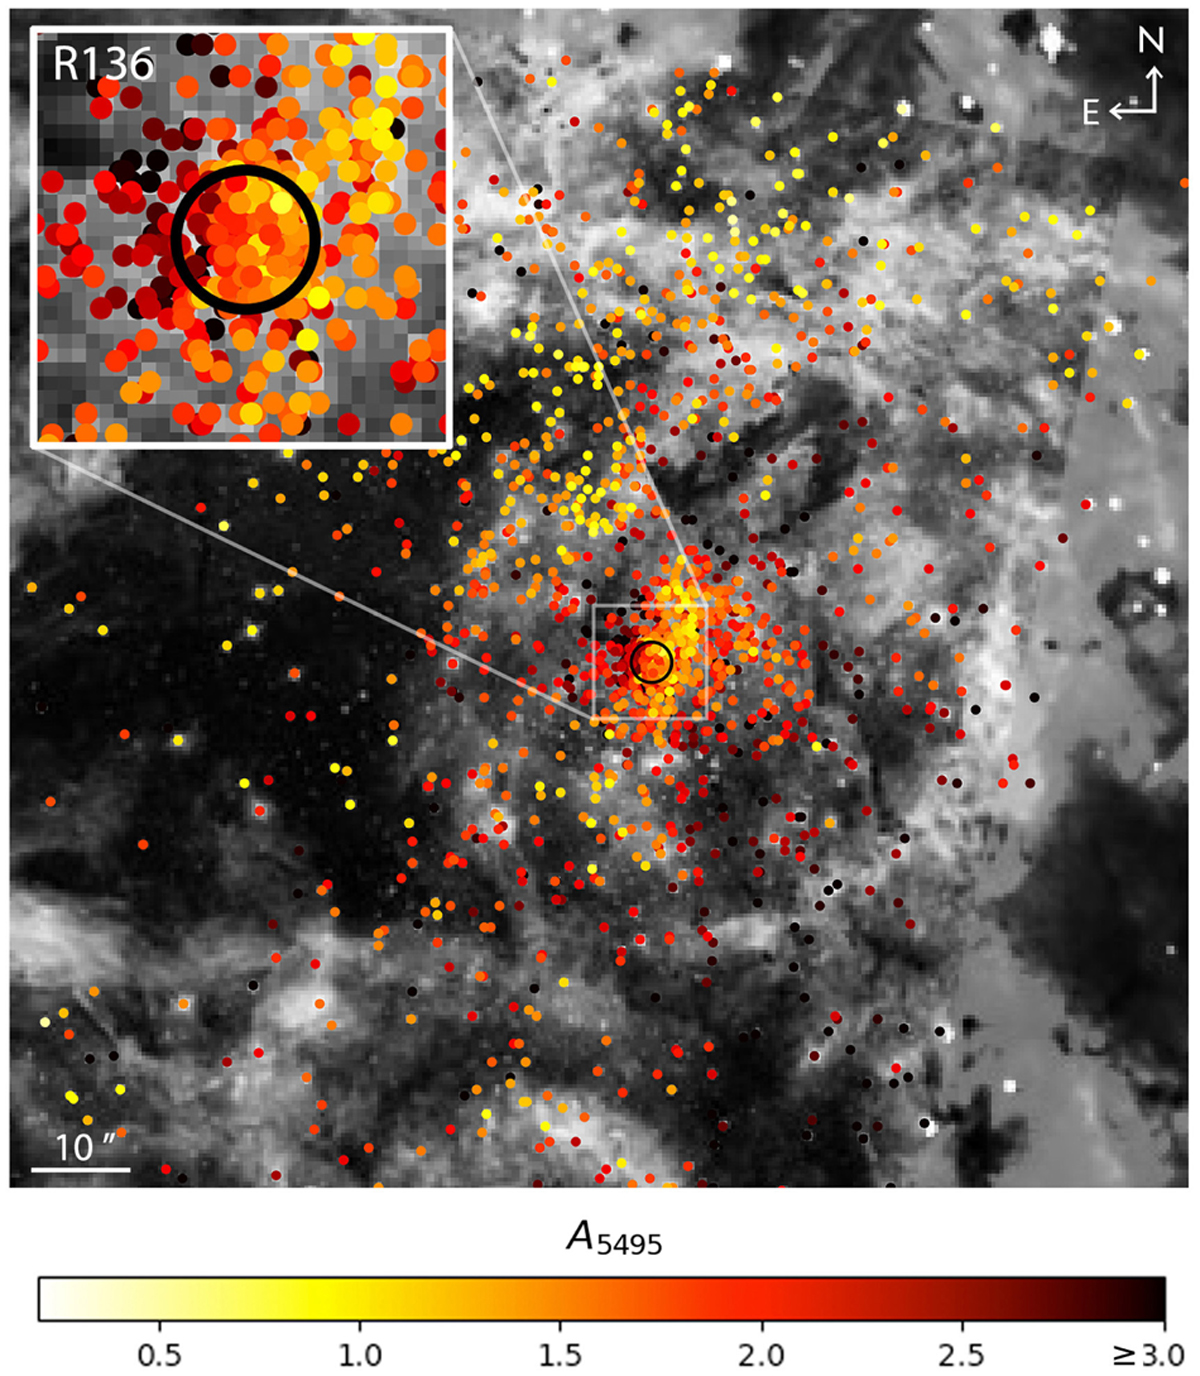
Extinction map of the R136 cluster and surroundings. The dots indicate stars of the De Marchi et al. (2011) sample for which AV was estimated using V – I (see Sect. 4.2), as well as stars in the core of the R136 cluster, for which AV was determined with a full SED fit. The core of the cluster is indicated with a black circle, and a zoom onto the core of the R136 cluster is shown in the inset in the upper left corner. We note that in order to make more details visible, the dots in the inset plot are of a smaller size relative to the background image than those of the main panel. Background image credits: ESO/R. Fosbury (ST-ECF), R. O'Connell (University of Virginia, Charlottesville), and the Wide Field Camera 3 Science Oversight Committee (colours adapted).
Current usage metrics show cumulative count of Article Views (full-text article views including HTML views, PDF and ePub downloads, according to the available data) and Abstracts Views on Vision4Press platform.
Data correspond to usage on the plateform after 2015. The current usage metrics is available 48-96 hours after online publication and is updated daily on week days.
Initial download of the metrics may take a while.